
India’s GDP new series uses 2022–23 as the base year for measuring national income at constant prices. The National Statistical Office released the series on 27 February 2026, replacing the 2011–12 base. The initial second advance estimate placed real GDP growth for 2025–26 at 7.6%; the newer provisional estimate released on 5 June 2026 revised it to 7.7%. The change is important for UPSC because rebasing alters the price structure, data sources and estimation methods used to describe the economy.
UPSC relevance: GS Paper III—Indian economy, growth, mobilisation of resources and inclusive development; Prelims—GDP, GVA, real versus nominal growth, base year and expenditure components.
Why is India’s GDP new series in the news?
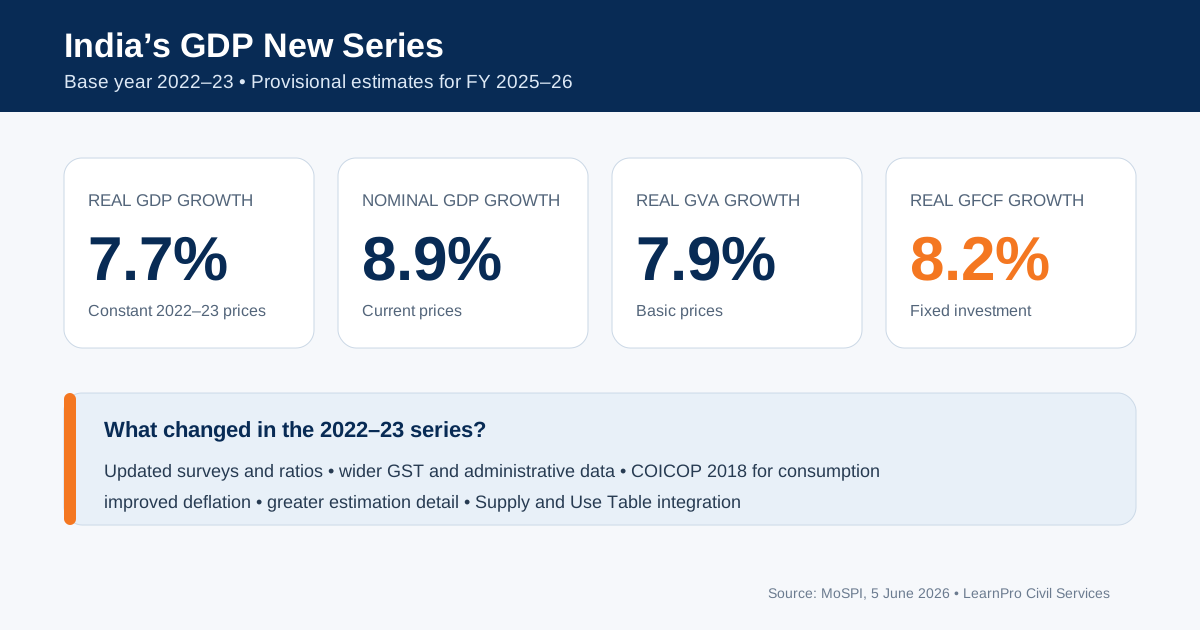
MoSPI introduced annual and quarterly national-account estimates with base year 2022–23 in February 2026. The second advance estimate under the new series showed 7.6% real growth for 2025–26. Once information for January–March became available, the provisional estimate revised annual real GDP growth to 7.7% and nominal GDP growth to 8.9%.
This distinction matters. Advance estimates are produced before complete information for the financial year is available and are revised as administrative, corporate, agricultural and expenditure data improve. A change from 7.6% to 7.7% does not imply manipulation; it reflects the normal revision cycle. Serious analysis should always state the estimate stage, release date and base year.
What does rebasing GDP mean?
GDP measures the market value of final goods and services produced within the domestic territory during a specified period. To compare production across years, statisticians calculate GDP at both current and constant prices.
- GDP at current prices values output using prices prevailing in the same year. It reflects both changes in output and prices.
- GDP at constant prices values output using the prices of a chosen base year. It is intended to measure changes in real production after removing the effect of price changes.
As the economy evolves, an old base year becomes less representative. Relative prices change, new products and industries emerge, consumption patterns shift and better administrative databases become available. Rebasing updates the benchmark structure against which real growth is calculated. It does not simply multiply the old series by a new number; methods, classifications, ratios and source data may also change.
Major changes in the 2022–23 GDP series
MoSPI identifies several methodological and data improvements:
- Updated rates and ratios: Recent surveys and methodological studies replace older benchmark relationships used in estimation.
- Greater use of GST and administrative data: Quarterly estimates draw more extensively on tax and other high-frequency databases.
- Improved consumption estimates: Private Final Consumption Expenditure uses the COICOP 2018 classification and additional survey and administrative data.
- Supply and Use Table integration: Better reconciliation of the production and expenditure sides is intended to reduce statistical discrepancies.
- Revised deflation strategy: More suitable and granular price indices are used to convert current-price values into constant-price estimates.
- Finer estimation detail: Greater disaggregation can capture sector-specific changes that broad indicators may miss.
The new series also uses a benchmark-indicator approach for quarterly and advance estimates. Previous benchmark values are extrapolated using indicators that reflect current activity. Consequently, revisions remain necessary as fuller annual data become available.
Latest official picture for 2025–26
| Indicator | 2025–26 provisional estimate | What it represents |
|---|---|---|
| Real GDP growth | 7.7% | Growth of domestic output at constant 2022–23 prices. |
| Nominal GDP growth | 8.9% | Growth at current prices, including price effects. |
| Real GVA growth | 7.9% | Growth in value added by producers at basic prices. |
| Primary-sector real growth | 3.2% | Agriculture and allied activities plus mining and quarrying. |
| Secondary-sector real growth | 8.8% | Manufacturing, utilities and construction. |
| Tertiary-sector real growth | 9.3% | Trade, transport, finance, professional and public services. |
| Real PFCE growth | 7.7% | Growth in household consumption expenditure. |
| Real GFCF growth | 8.2% | Growth in fixed investment such as machinery and structures. |
Real GDP at constant prices was provisionally estimated at ₹323.12 lakh crore in 2025–26, compared with ₹299.89 lakh crore in 2024–25. The official release attributes the year’s performance mainly to secondary and tertiary activities, while the primary sector grew more moderately.
GDP, GVA and net taxes: a common UPSC confusion
Gross Value Added measures the value producers add to goods and services. GDP at market prices incorporates the effect of product taxes and subsidies:
GDP at market prices = GVA at basic prices + product taxes − product subsidies
GDP and GVA growth can therefore differ when net product taxes change. GVA is useful for studying sectoral production; GDP is the standard aggregate for the size and growth of the economy at market prices. Candidates should not treat the two as interchangeable.
Why deflators and denominators matter
Deflators
A deflator removes price effects from a nominal value. No single price index perfectly represents every component of the economy. Agricultural output, manufactured goods, construction, government services and financial activities have different price structures. An inappropriate deflator can overstate or understate real growth. Greater product and sector detail therefore improves measurement, provided the underlying price data are timely and reliable.
Denominators
Ratios such as fiscal deficit-to-GDP, debt-to-GDP, tax-to-GDP and expenditure-to-GDP use nominal GDP as the denominator. When the nominal GDP series is revised, these ratios may change even if the rupee value of debt, tax or expenditure does not. A lower ratio is not automatically evidence of a policy improvement; analysts must check whether the numerator changed, the denominator changed, or both.
How should the 7.7% growth estimate be interpreted?
The headline shows strong aggregate momentum, but it is not a complete welfare measure.
- Composition: Growth led by manufacturing and services may have different employment effects from agriculture-led growth.
- Distribution: GDP does not show how income gains are distributed across households, regions or genders.
- Employment: Output can grow faster than good-quality job creation when production becomes more capital- or technology-intensive.
- Per-capita outcomes: Population growth must be considered when evaluating improvements in average material living standards.
- Environmental costs: Depletion, pollution and unpaid ecological damage are not fully captured in conventional GDP.
- Informal activity: Measurement remains difficult where reliable accounts and high-frequency records are limited.
For international comparisons, also distinguish market-exchange-rate GDP from purchasing-power-parity measures. LearnPro’s article on India’s position in the global economy explains why the choice of measure affects rankings.
Benefits and limitations of the new series
| Potential improvement | Continuing limitation or caution |
|---|---|
| A more recent price and production structure. | Any single base year can contain unusual sectoral conditions. |
| Wider administrative and GST databases. | Administrative data are designed for governance, not always for statistical measurement. |
| More detailed consumption and production estimates. | Granularity increases the need for consistent classification and quality control. |
| Improved reconciliation through Supply and Use Tables. | Discrepancies and subsequent revisions cannot be eliminated entirely. |
| Better quarterly indicators. | Advance estimates remain provisional and may change materially. |
Policy implications
- Use a dashboard, not one headline: Combine GDP with employment, wages, consumption, investment, inflation, exports and human-development indicators.
- Publish transparent documentation: Detailed sources, methods, revisions and bridge tables between old and new series help independent evaluation.
- Strengthen surveys: Enterprise, household and labour surveys remain essential even when administrative databases expand.
- Improve subnational statistics: Reliable State Domestic Product and district-level data are necessary for federal policy and regional analysis.
- Update related indices consistently: National accounts become more coherent when IIP and price-index revisions use compatible classifications and base structures.
- Connect growth with structural reform: Strong aggregate growth should support productive employment, skills, formalisation, infrastructure and value-chain upgrading. See LearnPro’s analysis of India’s export strategy.
UPSC revision box
- Base year of the new GDP series: 2022–23.
- Real GDP uses constant prices; nominal GDP uses current prices.
- GDP at market prices equals GVA at basic prices plus product taxes minus product subsidies.
- PFCE represents household consumption; GFCF is a measure of fixed capital formation.
- Rebasing can change sector weights, methods, deflators and historical growth estimates.
- Advance estimates are revised as more complete data become available.
Probable Mains question
“Rebasing national accounts is not merely a statistical exercise; it changes how economic performance and policy ratios are interpreted.” Discuss with reference to India’s 2022–23 GDP series.
Conclusion
India’s GDP new series provides a more current statistical framework through updated surveys, administrative data, classifications and deflation methods. The provisional 7.7% real-growth estimate for 2025–26 indicates strong aggregate performance, but its policy meaning depends on sectoral composition, employment, distribution and the quality of underlying data. UPSC answers should use the latest estimate while clearly stating the base year and revision stage.
Frequently asked questions on India’s GDP new series
What is the base year of India’s new GDP series?
The new national-accounts series uses 2022–23 as its base year, replacing the earlier 2011–12 series.
What was India’s real GDP growth in 2025–26?
The provisional estimate released by MoSPI on 5 June 2026 placed real GDP growth at 7.7%. The earlier second advance estimate had placed it at 7.6%.
Why is GDP rebased?
Rebasing updates the price structure, sector weights, data sources, classifications and estimation methods so constant-price growth better represents the contemporary economy.
What is the difference between real and nominal GDP?
Nominal GDP values output at current prices and includes price changes. Real GDP values output at constant base-year prices to estimate changes in production volume.
What is the relationship between GDP and GVA?
GDP at market prices equals GVA at basic prices plus product taxes minus product subsidies. GVA measures value added by producers, while GDP incorporates net product taxes.
Why can a GDP estimate be revised?
Advance estimates rely on partial-year indicators. They are revised as fuller corporate, government, agricultural, tax and expenditure data become available.
Does high GDP growth necessarily mean inclusive growth?
No. GDP does not by itself reveal employment quality, income distribution, regional inequality, environmental costs or access to health and education. These require separate indicators.
Official sources
- MoSPI provisional GDP estimates for 2025–26, 5 June 2026
- MoSPI press note on the 2022–23 GDP series, 27 February 2026