
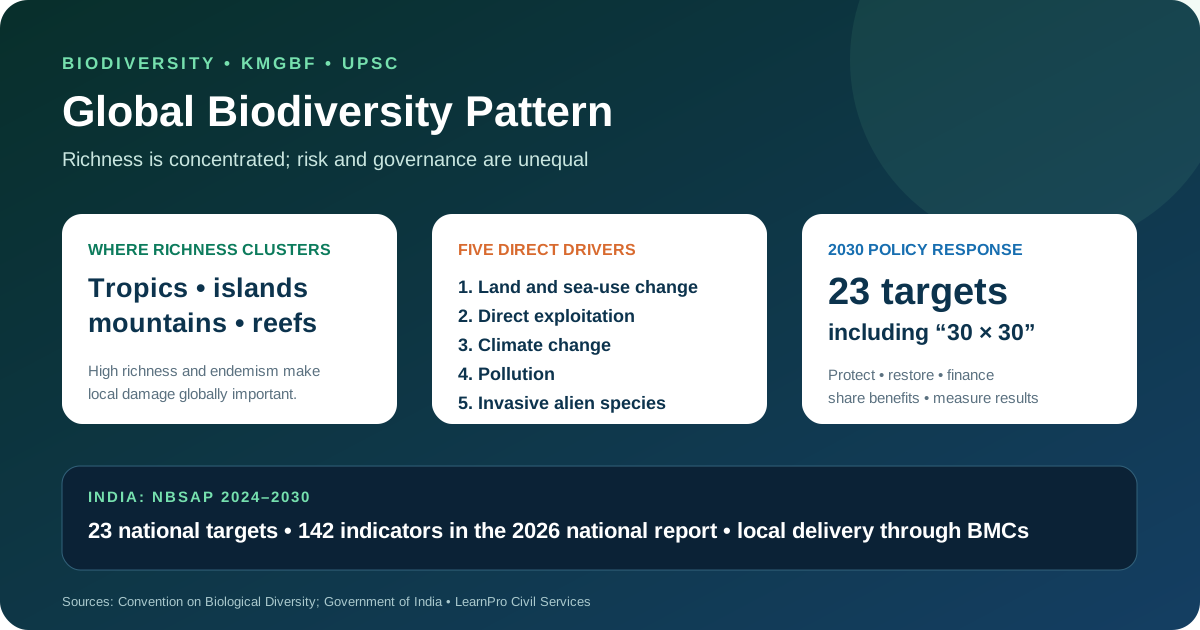
The global biodiversity pattern is uneven: species richness is generally highest in the tropics, while endemism and extinction risk concentrate in islands, mountains, forests, wetlands and other specialised habitats. These patterns matter because biodiversity supports food, water, pollination, climate regulation and disaster resilience. The Kunming–Montreal Global Biodiversity Framework (KMGBF) translates the crisis into 23 action targets for 2030.
UPSC relevance: GS Paper III—biodiversity, conservation and environmental governance; GS Paper I—biogeography; Prelims—KMGBF and the Biological Diversity Act. Focus keyword: global biodiversity pattern.
What shapes the global biodiversity pattern?
Biodiversity includes variation within species, between species and among ecosystems. It is not distributed uniformly. Climate, energy, water, evolutionary history, habitat area, isolation and disturbance interact to produce broad patterns.
| Pattern | Simple explanation | Conservation implication |
|---|---|---|
| Latitudinal gradient | Species richness usually increases from poles to tropics. | Tropical habitat loss can remove many species from a small area. |
| Species–area relationship | Larger, connected habitats generally support more species. | Fragmentation reduces effective habitat and isolates populations. |
| Endemism | Islands, mountains and isolated habitats contain species found nowhere else. | Local habitat destruction can cause global extinction. |
| Marine concentration | Coral reefs, coasts and upwelling zones support high productivity and diversity. | Warming, acidification, pollution and overuse act together. |
| Freshwater risk | Rivers and wetlands occupy limited area but support specialised life. | Dams, extraction, pollution and invasive species disrupt connectivity. |
What is driving biodiversity loss?
- Land- and sea-use change: conversion and fragmentation of forests, grasslands, wetlands and coasts.
- Direct exploitation: unsustainable fishing, hunting, logging and wildlife trade.
- Climate change: shifting ranges, altered seasons, marine heatwaves and coral bleaching.
- Pollution: nutrients, pesticides, plastics, industrial chemicals, noise and light.
- Invasive alien species: introduced organisms that outcompete, prey on or alter native ecosystems.
These drivers reinforce one another. A fragmented population has less room to shift under warming; a polluted wetland is less resilient to drought; overharvest can remove the very species that maintain ecosystem structure.
What is the Kunming–Montreal Global Biodiversity Framework?
Parties to the Convention on Biological Diversity adopted the KMGBF in 2022. It sets four goals for 2050 and 23 targets for 2030. Frequently tested elements include:
- effective conservation and management of at least 30% of terrestrial, inland-water, coastal and marine areas by 2030;
- restoration of at least 30% of degraded ecosystems;
- reduction of extinction risk and recovery of threatened species;
- control of invasive alien species;
- reduction of harmful pollution and biodiversity-risk from pesticides;
- reform of incentives harmful to biodiversity;
- fair and equitable sharing of benefits from genetic resources and digital sequence information; and
- mobilisation of finance, knowledge and capacity.
The “30×30” target is not a licence for paper parks or displacement. The framework requires areas to be effectively managed, ecologically representative, well connected and equitably governed, while recognising indigenous and traditional territories.
How has India aligned its policy?
India released an updated National Biodiversity Strategy and Action Plan (NBSAP) 2024–2030 aligned with the KMGBF. It uses 23 National Biodiversity Targets and a whole-of-government and whole-of-society approach. The legal foundation includes the Biological Diversity Act, 2002, its 2023 amendment, the Biological Diversity Rules and institutions at national, State and local levels.
| Institution | Main role |
|---|---|
| National Biodiversity Authority | National regulation, advice and access-and-benefit-sharing functions |
| State Biodiversity Boards | State-level regulation and guidance |
| Biodiversity Management Committees | Local conservation, sustainable use and People’s Biodiversity Registers |
| Line ministries and States | Mainstream biodiversity into forests, agriculture, fisheries, infrastructure and coasts |
What does India’s 2026 national report say?
India submitted its Seventh National Report to the CBD in March 2026. The government assessment uses 142 indicators mapped to 23 national targets and reports all targets as “on track to achieve”. It also reports:
- total forest and tree cover of 25.17% of geographical area;
- 98 Ramsar sites at the reporting point;
- 58 tiger reserves, 33 elephant reserves, 18 biosphere reserves, 106 national parks and 574 wildlife sanctuaries;
- more than 5,600 access-and-benefit-sharing agreements and ₹140 crore disbursed; and
- 2,76,653 Biodiversity Management Committees and 2,72,648 People’s Biodiversity Registers.
“On track” is a monitoring judgement, not proof that ecological decline has ended. Area counts do not by themselves measure habitat quality, connectivity, population viability or fairness. Independent field data and transparent indicator methods remain essential.
Why is biodiversity an economic risk?
Businesses and governments depend on ecosystem services but often treat their depletion as an external cost.
- Agriculture: pollinators, soil organisms, water regulation and crop genetic diversity support production.
- Fisheries: mangroves, estuaries and reefs provide nursery habitat.
- Infrastructure: wetlands store floodwater and vegetation stabilises slopes.
- Health: ecosystem disruption can alter disease exposure and remove sources of medicines.
- Finance: firms face physical, transition, liability and supply-chain risk when nature degrades.
LearnPro’s note on forest carbon and climate mitigation shows why climate and biodiversity policies overlap but are not interchangeable.
Where does the delivery gap arise?
- Weak baselines: many taxa and ecosystems lack consistent long-term data.
- Fragmented approvals: projects are assessed separately even when their cumulative landscape impact is large.
- Finance mismatch: restoration and local stewardship need predictable funding beyond short projects.
- Perverse incentives: subsidies or infrastructure choices may encourage habitat conversion.
- Quality versus area: plantations, degraded forest and intact ecosystems are not ecologically equivalent.
- Participation: conservation without secure rights or benefit sharing can create conflict and weak compliance.
A credible implementation strategy
- publish target-wise baselines, methods and annual progress;
- protect ecological connectivity, not only isolated protected areas;
- use strategic and cumulative assessment for high-pressure landscapes;
- fund Biodiversity Management Committees and improve the quality and use of People’s Biodiversity Registers;
- link access-and-benefit sharing to documented community custodianship;
- remove or redesign incentives that damage nature; and
- measure restoration through native diversity, ecosystem function and survival, not planting counts alone.
UPSC answer framework
Begin with the tropical richness and endemism pattern. Explain the five direct drivers, then connect KMGBF targets with India’s NBSAP and three-tier biodiversity institutions. Use the 2026 national-report indicators, but add the caution that numerical coverage must translate into ecological quality and community legitimacy.
Probable question: Why does the global biodiversity pattern require conservation strategies that go beyond expanding protected-area coverage?
Conclusion
The global biodiversity pattern combines concentrated richness, narrow endemism and unequal exposure to human pressure. KMGBF provides a common direction, while India’s NBSAP converts it into national targets. Success must be judged by recovering species, functioning ecosystems, connected landscapes and fair benefits—not only by notifications, hectares or committees created.
Frequently asked questions
Why is biodiversity generally higher in the tropics?
Long-term climatic stability, high solar energy and rainfall, complex habitats and evolutionary history together support more species, although the strength of each explanation varies by group and region.
What is the KMGBF?
The Kunming–Montreal Global Biodiversity Framework is the CBD’s global framework with four 2050 goals and 23 targets for 2030.
What does 30×30 mean?
It refers to conserving and effectively managing at least 30% of terrestrial, inland-water, coastal and marine areas by 2030, with attention to representation, connectivity and equitable governance.
What is a Biodiversity Management Committee?
It is a local body constituted under India’s biodiversity framework to support conservation, sustainable use, documentation and benefit sharing.
Is forest cover the same as biodiversity?
No. Forest-cover area does not by itself reveal native-species diversity, structure, ecological function, connectivity or the condition of wildlife populations.
Official sources
- Convention on Biological Diversity: Kunming–Montreal Global Biodiversity Framework
- MoEFCC: launch of India’s updated NBSAP
- MoEFCC: India’s Seventh National Report, March 2026