
India’s SDG Index ranking entered the global top 100 for the first time in the Sustainable Development Report 2025, when India ranked 99th. The latest Sustainable Development Report 2026 places India at 95th out of 169 ranked countries, with an overall score of 68.33. The direction is positive, but a rank improvement does not mean that India has achieved the 17 Sustainable Development Goals.
The Sustainable Development Report (SDR) is produced by the UN Sustainable Development Solutions Network and partners. It is an independent global assessment that complements official UN indicators and national Voluntary National Reviews; it should not be described as an official UN country ranking.
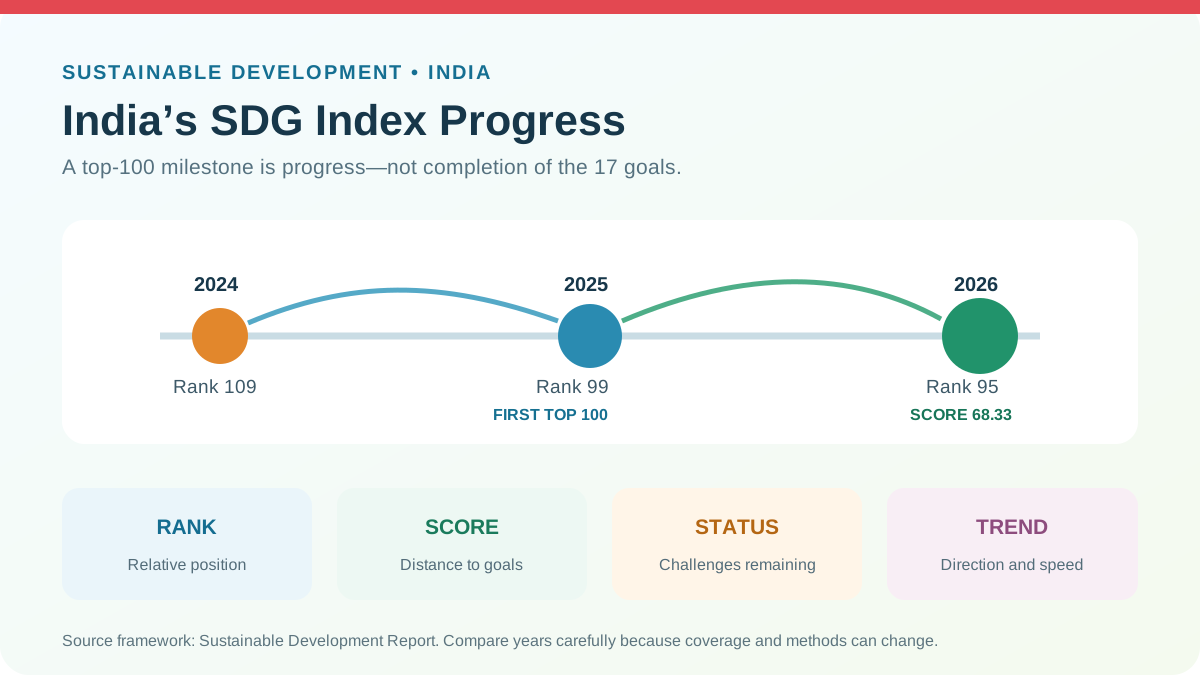
India’s SDG Index ranking: key facts
| Report year | India’s rank | What it shows |
|---|---|---|
| 2024 | 109th | India remained outside the top 100. |
| 2025 | 99th | India entered the top 100 for the first time; the reported score was about 67. |
| 2026 | 95th of 169 | The latest dashboard reports a score of 68.33 and a further four-place improvement. |
The 2025 report ranked 167 countries, while the 2026 ranking covers 169. Year-to-year ranks must therefore be read with care: the country set, indicators, data revisions and methods can change. The score is usually more informative than the rank because it measures India’s distance from full SDG achievement on a 0–100 scale.
What does the SDG Index score mean?
The overall SDG Index score summarises performance across all 17 goals. A score of 100 would indicate achievement of the SDGs under the Index methodology. India’s 2026 score of 68.33 can be read as roughly 68.33% of the way towards full achievement on the measured indicators—not as 68.33% of targets legally completed.
The country dashboard adds two kinds of information:
- Goal status: whether a goal is achieved or whether challenges, significant challenges or major challenges remain.
- Trend: whether indicators are on track, moderately improving, stagnating or decreasing.
A country can improve its score while still facing major challenges. It can also rise in rank because other countries progress more slowly. Good analysis should therefore examine rank, score, goal status and trend together.
What is the Sustainable Development Report?
The SDR has reviewed country progress since the 17 SDGs were adopted by all UN Member States in 2015. The goals cover poverty, hunger, health, education, gender equality, water, clean energy, decent work, infrastructure, inequality, cities, consumption, climate, oceans, land, institutions and partnerships.
The Index combines comparable international indicators into goal-level scores and an overall score. It also reports spillover effects—the positive or negative effects that one country’s consumption, trade, finance or environmental footprint can impose on other countries.
The 2025 edition also introduced a streamlined SDGi using 17 headline indicators to study progress since 2015. This should not be confused with the full SDG Index ranking. LearnPro’s foundational guide to the 17 Sustainable Development Goals explains every goal and its core purpose.
Why has India’s performance improved?
No single scheme explains a composite index. Improvement reflects the combined effect of economic growth, public services, infrastructure, financial inclusion, energy access, sanitation, digital delivery and State-level implementation. NITI Aayog’s domestic SDG India Index 2023–24 reported a national score of 71, up from 66 in 2020–21 and 57 in the 2018 baseline.
| Area | Examples of policy contribution | Remaining test |
|---|---|---|
| Basic services | Housing, household electrification, clean cooking, drinking water and sanitation programmes | Reliability, affordability, water quality and sustained use |
| Financial inclusion | Bank accounts, direct transfers and digital public infrastructure | Meaningful account use, credit access and protection from fraud |
| Health | Insurance coverage, primary-care facilities, immunisation and maternal-health programmes | Public-health capacity, nutrition, out-of-pocket expenditure and workforce gaps |
| Clean energy | Renewable capacity, efficiency, electric mobility and clean-energy missions | Grid flexibility, storage, coal transition and affordable access |
| Poverty reduction | Food security, employment support, housing and service delivery | Quality jobs, urban vulnerability and resilience to shocks |
NITI Aayog reported particularly visible improvement in Goals 1, 8, 13 and 15 in its 2023–24 domestic index. It also found all States improved their overall score, although State scores still ranged from 57 to 79. This shows both progress and persistent regional inequality.
Global SDG Index and SDG India Index are different
| Feature | Global Sustainable Development Report Index | NITI Aayog SDG India Index |
|---|---|---|
| Producer | SDSN and research partners | NITI Aayog, Government of India |
| Unit compared | Countries | Indian States and Union Territories |
| Purpose | International benchmarking | Sub-national monitoring and cooperative competition |
| Indicators | Internationally comparable datasets | National indicators adapted to Indian policy and data systems |
| Latest figure used here | India: rank 95, score 68.33 in 2026 | India composite score: 71 in 2023–24 |
The two scores should not be treated as contradictory because they use different indicator sets, normalisation methods and comparison groups.
Where do major challenges remain?
1. Nutrition and learning outcomes
School enrolment or food distribution does not automatically guarantee learning or good nutrition. Policy must track child growth, dietary diversity, anaemia, foundational literacy and the quality of public services. LearnPro’s analysis of India’s nutritional security framework explains the shift from calorie delivery to measurable outcomes.
2. Gender equality
Progress requires more than welfare coverage. Women need safe mobility, asset ownership, quality employment, equal pay, political voice, digital access and freedom from violence.
3. Quality employment
High growth must generate productive jobs with social security, especially for young people and women. Informality can weaken progress on poverty, inequality, health and education at the same time.
4. Sustainable cities
Urban India faces air pollution, heat stress, housing shortages, traffic, waste and unequal access to basic services. Local governments need predictable finance, technical capacity and reliable ward-level data.
5. Climate and biodiversity
Renewable-energy expansion must be combined with adaptation, ecosystem protection and a fair transition for workers and regions dependent on fossil fuels. Financing these outcomes requires high-quality climate finance for mitigation and adaptation.
6. State and district inequality
National averages can hide weak districts, social groups and urban settlements. Disaggregated data by sex, caste, tribe, disability, income and location is necessary to honour the SDG principle of leaving no one behind.
Why rank improvement is not enough
- Relative measure: rank depends partly on how other countries perform.
- Data lag: many international indicators describe conditions from earlier years.
- Indicator revision: changes in data or methodology affect comparability.
- Average effect: a composite score can conceal severe deprivation among specific groups.
- Trade-offs: growth in one area can damage another—for example, infrastructure that harms ecosystems.
- Implementation quality: expenditure or scheme coverage is not the same as a durable outcome.
The correct conclusion is therefore modest: India’s rank and score show broad improvement, but not completion of the 2030 Agenda.
A policy agenda for faster SDG progress
- Target lagging districts: combine national entitlements with place-specific action plans.
- Measure outcomes: track learning, nutrition, health, water quality and job quality—not only inputs.
- Strengthen local governments: provide municipalities and panchayats with funds, functions, staff and data systems.
- Integrate budgets with SDGs: link spending, outputs and measurable outcomes across departments.
- Use disaggregated data: identify who is excluded and prevent averages from hiding inequality.
- Avoid policy trade-offs: assess social and ecological effects before approving major investments.
- Mobilise long-term finance: combine domestic public investment, private capital and international development and climate finance.
- Independent evaluation: publish open data and allow academic and citizen scrutiny.
UPSC relevance
India’s SDG Index ranking is relevant to GS Paper II under welfare, governance and international institutions, and GS Paper III under inclusive growth, environment and sustainable development. It is also useful in essays on development measurement.
Possible Mains question: “India’s entry into the top 100 of the SDG Index is significant, but rankings can conceal implementation gaps. Critically examine.”
Conclusion
India’s entry at rank 99 in 2025 was a real milestone, and the 2026 rank of 95 with a score of 68.33 indicates continued improvement. Yet the SDGs are about ending deprivation within ecological limits, not winning a league table. The next phase must convert national progress into better nutrition, learning, jobs, gender equality, resilient cities and healthy ecosystems in every district.
Frequently asked questions
What is India’s SDG Index ranking in 2026?
The Sustainable Development Report 2026 ranks India 95th out of 169 ranked countries, with an overall SDG Index score of 68.33.
When did India first enter the top 100 of the SDG Index?
India entered the top 100 for the first time in the Sustainable Development Report 2025, at rank 99.
Is the Sustainable Development Report an official UN ranking?
No. It is an independent assessment produced by the UN Sustainable Development Solutions Network and research partners. It complements official UN indicators and national reviews.
What does an SDG Index score of 68.33 mean?
It summarises India’s measured progress towards all 17 SDGs on a 0–100 scale. It does not mean that 68.33% of legal targets have formally been completed.
How is the global SDG Index different from NITI Aayog’s index?
The global index compares countries using international data. NITI Aayog’s SDG India Index compares Indian States and Union Territories using a nationally adapted indicator framework.
Authoritative references
- Sustainable Development Report 2026: global rankings
- Sustainable Development Report 2025
- NITI Aayog: SDG India Index 2023–24 results





Sources and further reading
- Sustainable Development Report 2026: global rankingsdashboards.sdgindex.org
- Sustainable Development Report 2025sdgtransformationcenter.org
- NITI Aayog: SDG India Index 2023–24 resultspib.gov.in