
Source: CPCB data; Sunday Guardian and Hindustan Times reports, 9 November 2026
For Prelims: National Air Quality Index (NAQI), CPCB, PM2.5 and PM10, National Ambient Air Quality Standards (NAAQS), WHO Air Quality Guidelines 2021, US EPA AQI, GRAP, SAFAR.
For Mains: Air quality monitoring and data credibility, public health impact of air pollution, festival-time pollution, role of the CPCB and State pollution control bodies.
Table of Contents
- Why in News?
- Key Highlights
- What is the National Air Quality Index (NAQI)?
- Why do CPCB and Private Apps Show Different Numbers?
- Health Impact of PM2.5
- Concerns
- Way Forward
- Conclusion
- UPSC Previous Year Questions (PYQs)
- Prelims Practice Question
- Mains Practice Question
- Frequently Asked Questions (FAQs)
- Related Reads on LearnPro
Why in News?
“Delhi AQI” was the most searched term in India on 9 November 2026, with over 5 lakh searches, after the capital’s air turned toxic following Deepavali. The Central Pollution Control Board (CPCB) recorded Delhi’s average AQI at 483 (‘Severe’) at about 8 a.m. on 9 November, while private platforms such as IQAir showed readings above 1,000 in areas like Shahdara and Defence Colony. The gap has raised questions about how air quality is measured and reported.
Key Highlights
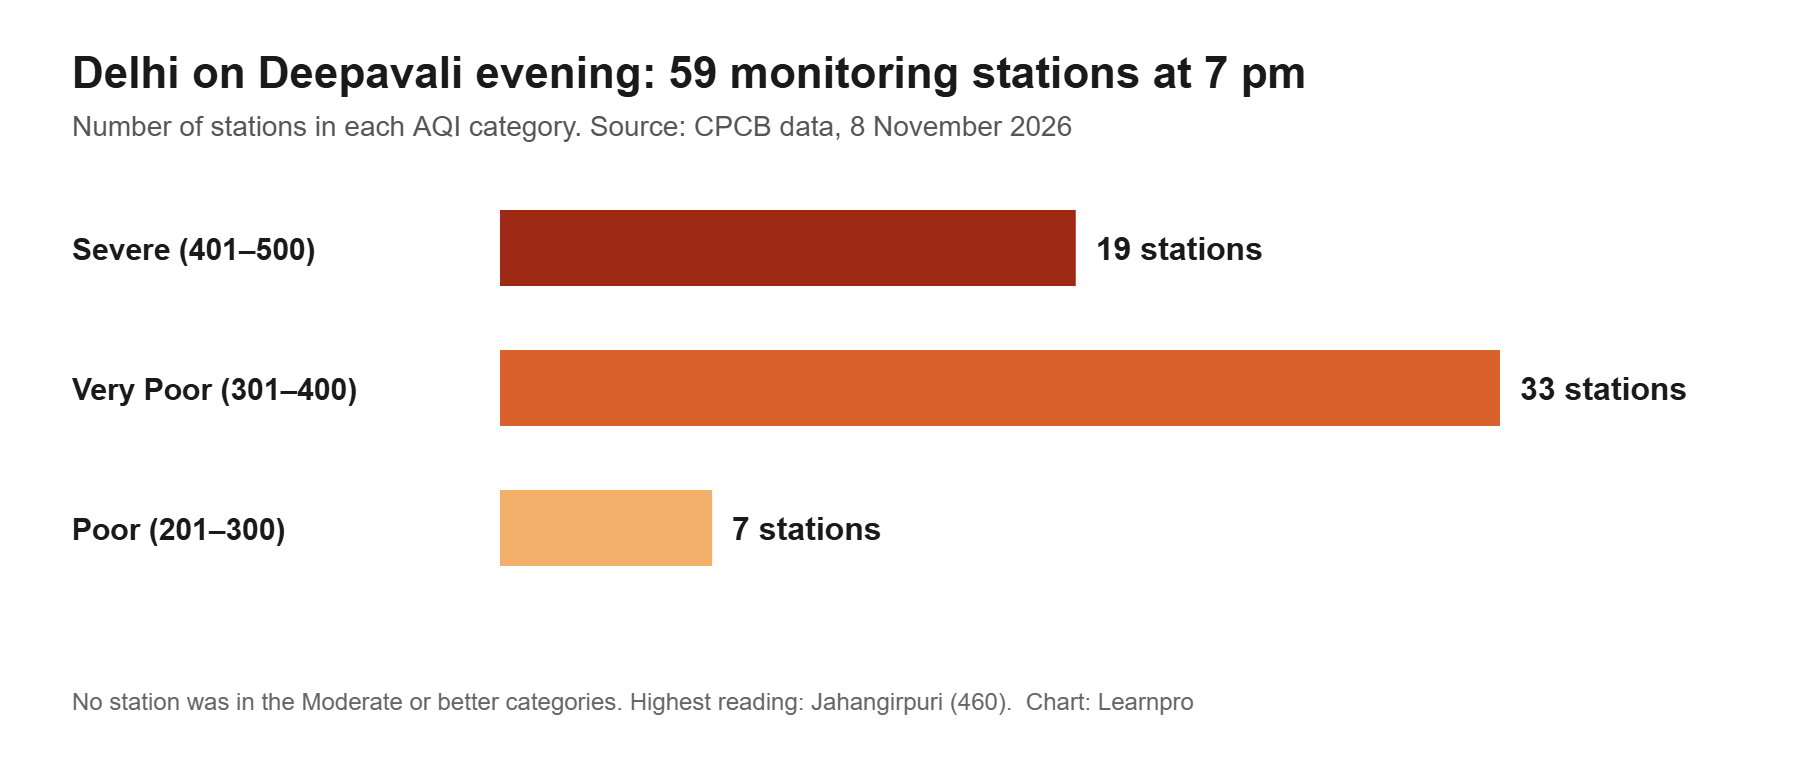
- At 7 p.m. on Deepavali, all 59 CPCB stations in Delhi were in the Poor, Very Poor or Severe category; Jahangirpuri recorded the highest reading at 460.
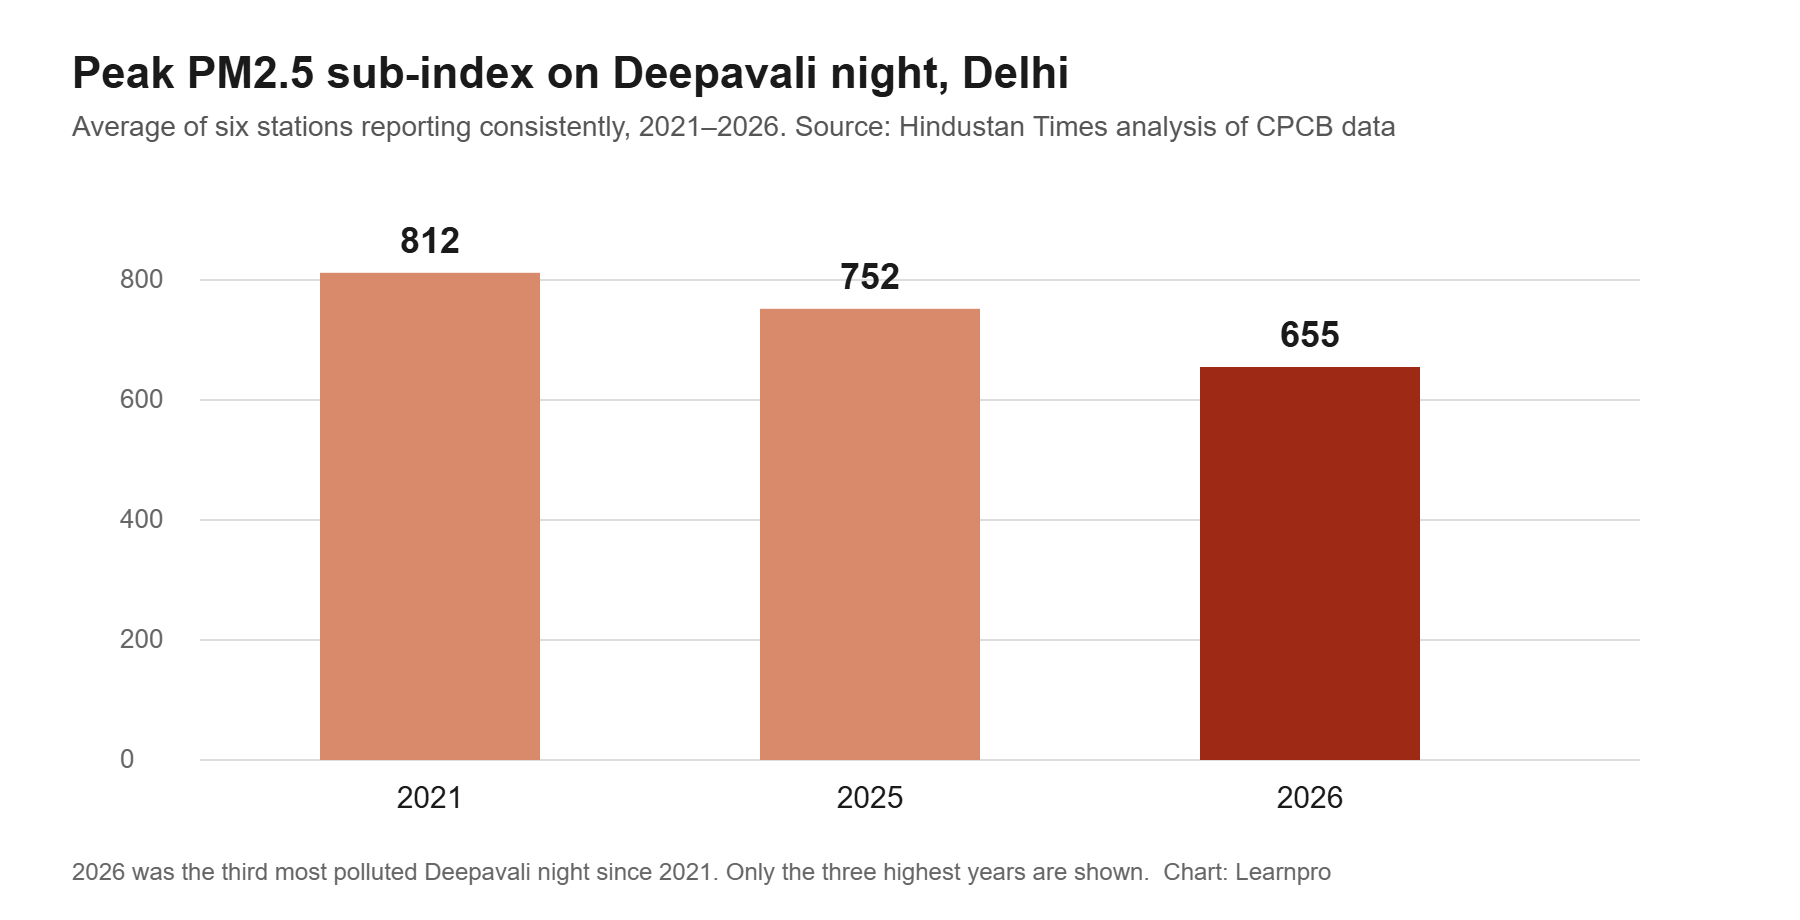
- More than half of Delhi’s monitoring stations reportedly stopped reporting data around midnight, as pollution peaked.
- A display board outside the IMD office showed an AQI of 143 (‘Moderate’), while CPCB data for the same area (Lodhi Road) showed about 343 (‘Very Poor’). The board is managed by the Delhi Pollution Control Committee (DPCC).
- The Opposition has alleged that new monitoring stations in greener areas lower the city’s average; these allegations have not been independently verified.
- The spike came despite GRAP Stage III curbs being in force across Delhi-NCR since three days before Deepavali.
What is the National Air Quality Index (NAQI)?
- Launch: Launched in 2014 by the Ministry of Environment, Forest and Climate Change under the Swachh Bharat Abhiyan, based on the recommendations of an expert group with IIT Kanpur.
- Pollutants: Eight – PM10, PM2.5, NO2, SO2, CO, O3, NH3 and Pb.
- Method: A sub-index is calculated for each pollutant from its concentration (24-hour average for most; 8-hour for CO and O3). The highest sub-index becomes the AQI, and that pollutant is the “prominent pollutant”. At least three pollutants, one of them PM2.5 or PM10, are needed.
- Scale: 0 to 500, in six colour-coded categories. Readings beyond the top breakpoint are shown as 500 or “500+”.
- Agencies: CPCB with State Pollution Control Boards and committees operate the Continuous Ambient Air Quality Monitoring Stations (CAAQMS).
Why do CPCB and Private Apps Show Different Numbers?
| Point of difference | Indian NAQI (CPCB) | Private platforms (e.g., IQAir) |
|---|---|---|
| Scale used | Indian breakpoints, 0–500 | Usually the US EPA AQI; some extend the scale beyond 500 |
| Averaging period | 24-hour rolling average for PM2.5/PM10 | Often near real-time (hourly or shorter) readings |
| Sensors | Regulatory-grade monitoring stations | Mix of reference monitors and low-cost sensors, which need calibration |
| Location | Fixed official stations; city average of stations reporting | Hyper-local readings, often at hotspots |
| Cap | Values above the top breakpoint are shown as 500+ | Can show values above 500, even above 1,000 |
Same PM2.5 Level, Different Labels
| PM2.5 (µg/m³, 24-hr) | Indian AQI category | US EPA AQI category (2024) |
|---|---|---|
| 0–30 | Good (0–50) | Good up to 9; Moderate from 9.1 |
| 31–60 | Satisfactory (51–100) | Moderate up to 35.4; Unhealthy for Sensitive Groups from 35.5 |
| 61–90 | Moderate (101–200) | Unhealthy for Sensitive Groups / Unhealthy (from 55.5) |
| 91–120 | Poor (201–300) | Unhealthy |
| 121–250 | Very Poor (301–400) | Unhealthy / Very Unhealthy (from 125.5) |
| Above 250 | Severe (401–500) | Hazardous (from 225.5) |
Takeaway: India’s scale is more lenient at lower concentrations. For reference, India’s 24-hour NAAQS for PM2.5 is 60 µg/m³, while the WHO 2021 guideline is 15 µg/m³.
Health Impact of PM2.5
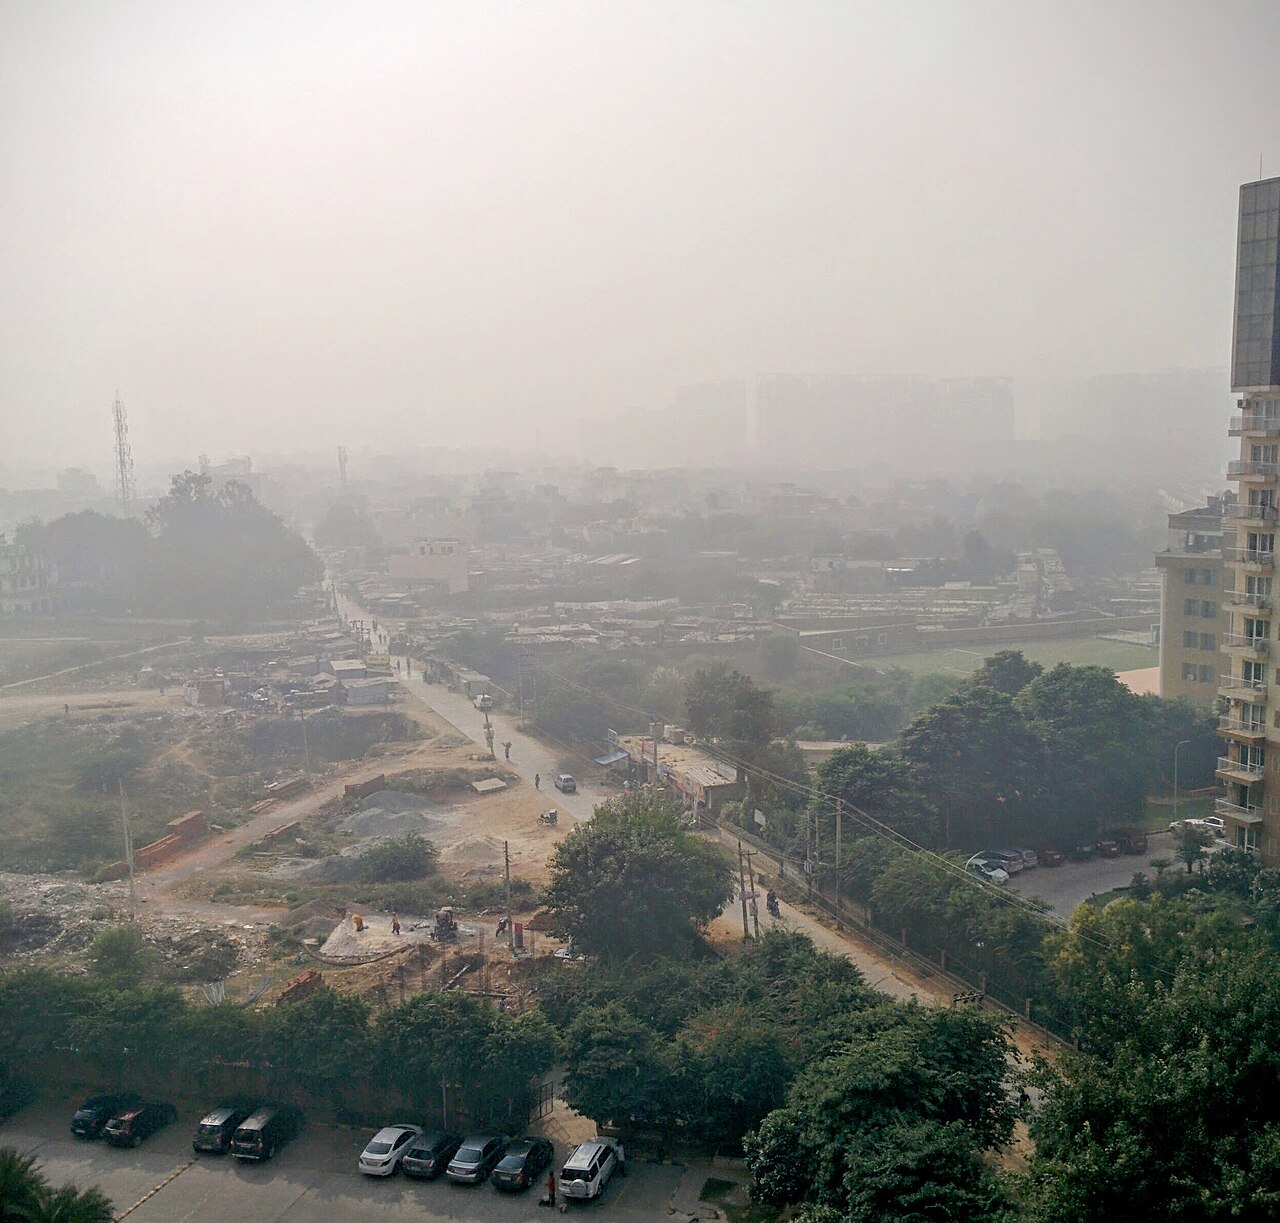
- PM2.5 particles are small enough to enter deep into the lungs and the bloodstream.
- Exposure is linked to asthma, chronic obstructive pulmonary disease, heart attacks, strokes, lung cancer and low birth weight.
- Children, the elderly, outdoor workers and people with existing illness are most vulnerable.
Concerns
- Data gaps: Stations going offline during peak pollution weaken trust and make year-on-year comparison difficult.
- Averaging hides peaks: A 24-hour average and city-wide mean can understate short, intense exposure in hotspots.
- Capped scale: The 500 ceiling means “Severe” does not show how much worse the air has become.
- Weak enforcement: Firecracker bans and GRAP curbs were widely violated.
- Political contestation: Allegations of data manipulation, whether true or not, erode public confidence.
Way Forward
- Transparent data: Publish raw station-level data, uptime and calibration records; independent audit of the monitoring network.
- Revise the AQI and NAAQS: Update standards (last revised in 2009) closer to WHO guidelines and add an “Extreme” band above 500.
- Health-based alerts: Link AQI levels with clear health advisories, school and outdoor-work rules.
- Hyper-local monitoring: Use calibrated low-cost sensors to complement regulatory stations.
- Address sources year-round: Strengthen the National Clean Air Programme (NCAP) on vehicles, dust, industry and crop burning.
Conclusion
An air quality index is only as useful as the trust people place in it. To protect public health, India needs a monitoring system that is transparent, scientifically updated and backed by firm year-round action against pollution sources.
UPSC Previous Year Questions (PYQs)
UPSC Prelims 2016
Q. In the cities of our country, which among the following atmospheric gases are normally considered in calculating the value of Air Quality Index? 1. Carbon dioxide 2. Carbon monoxide 3. Nitrogen dioxide 4. Sulfur dioxide 5. Methane Select the correct answer using the code given below.
- 1, 2 and 3 only
- 2, 3 and 4 only
- 1, 4 and 5 only
- 1, 2, 3, 4 and 5
Show answer
Answer: (b) — See full explanation
UPSC Prelims 2022
Q. In the context of WHO Air Quality Guidelines, consider the following statements : 1. The 24-hour mean of PM 2.5 should not exceed 15 µg/m3 and annual mean of PM2.5 should not exceed 5 µg/m3. 2. In a year, the highest levels of ozone pollution occur during the periods of inclement weather. 3. PM10 can penetrate the lung barrier and enter the bloodstream. 4. Excessive ozone in the air can trigger asthma. Which of the statements given above are correct?
- 1, 3 and 4
- 1 and 4 only
- 2, 3 and 4
- 1 and 2 only
Show answer
Answer: (b) — See full explanation
UPSC Prelims 2018
Q. How is the National Green Tribunal (NGT) different from the Central Pollution Control Board (CPCB)? 1. The NGT has been established by an Act whereas the CPCB has been created by an executive order of the Government. 2. The NGT provides environmental justice and helps reduce the burden of litigation in the higher courts whereas the CPCB promotes cleanliness of streams and wells, and aims to improve the quality of air in the country. Which of the statements given above is/are correct?
- 1 only
- 2 only
- Both 1 and 2
- Neither 1 nor 2
Show answer
Answer: (b) — See full explanation
Prelims Practice Question
Q. With reference to India’s National Air Quality Index (NAQI), consider the following statements:
- It considers eight pollutants, including ammonia and lead.
- The overall AQI is the average of the sub-indices of all pollutants measured.
- An AQI value between 301 and 400 is classified as ‘Very Poor’.
Which of the statements given above is/are correct?
(a) 1 and 2 only
(b) 1 and 3 only
(c) 2 and 3 only
(d) 1, 2 and 3
Answer: (b) — The AQI is the highest sub-index, not the average.
Mains Practice Question
Q. Differences between official and private air quality readings have raised questions over India’s air quality monitoring system. Discuss the reasons for these differences and suggest reforms to make air quality data more reliable and useful for public health. (250 words)
Frequently Asked Questions (FAQs)
How is the AQI calculated in India?
A sub-index is calculated for each of up to eight pollutants. The highest sub-index becomes the AQI. At least three pollutants, including PM2.5 or PM10, must be measured.
Why does the official AQI stop at 500?
India’s AQI scale runs from 0 to 500. Concentrations above the top breakpoint are shown as 500 or “500+”, so the scale does not show how much worse the air gets beyond that point.
Why do apps like IQAir show higher numbers than the CPCB?
They often use the US EPA scale, near real-time readings, hyper-local sensors and an open-ended scale, while the CPCB uses 24-hour averages from regulatory stations.
What is the WHO guideline for PM2.5?
The WHO 2021 guidelines recommend a 24-hour mean of no more than 15 µg/m³ and an annual mean of 5 µg/m³. India’s 24-hour standard is 60 µg/m³.
Related Reads on LearnPro
- GRAP Stage III Invoked in Delhi-NCR: Understanding the Graded Response Action Plan
- Delhi Air Pollution: Supreme Court on GRAP and CAQM
- Mains practice: How far is India’s National Clean Air Programme constrained by governance?
- Mains practice: Why episodic severe air pollution persists in north India