
Tags: GS Paper 1 – Physical Geography: Indian Monsoon, Ocean–Atmosphere Interactions
For Prelims: El Niño, La Niña, ENSO, Oceanic Niño Index, Walker circulation, Indian Ocean Dipole, Madden–Julian Oscillation, Long Period Average, IMD rainfall categories
For Mains: Teleconnections affecting the Indian monsoon, improving seasonal forecasts, agricultural implications of El Niño
Why in News?
The 2026 southwest monsoon ended nearly 13% below the Long Period Average (LPA) of 87 cm as a strong El Niño, expected to peak in December, developed. Yet in 1997, one of the strongest El Niños of the 20th century, India received normal rainfall. This raises the question of why El Niño does not always cause drought in India.
What is El Niño?
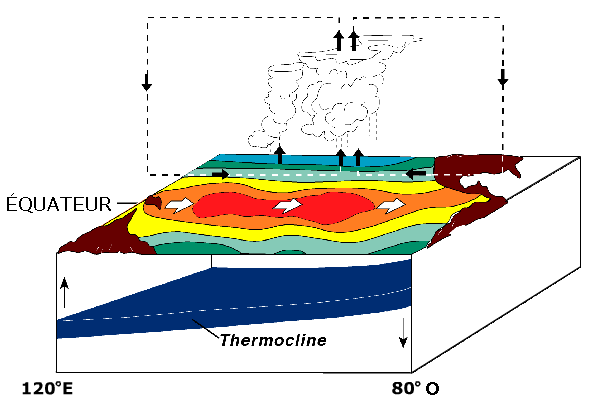
- Normally, trade winds blow from east to west across the equatorial Pacific and pile warm water near Indonesia. This drives the Walker circulation, with rising air over the western Pacific and sinking air over South America.
- During El Niño, the trade winds weaken every 2–7 years, and warm water spreads to the central and eastern Pacific. Rising air shifts east, and sinking air over the Indian region suppresses rainfall.
- La Niña is the opposite phase and usually brings above-normal monsoon rain to India.
- Measure: NOAA’s Oceanic Niño Index (ONI). An ONI of +0.5°C or more indicates El Niño, and +1.5°C or more a strong El Niño.
The Track Record
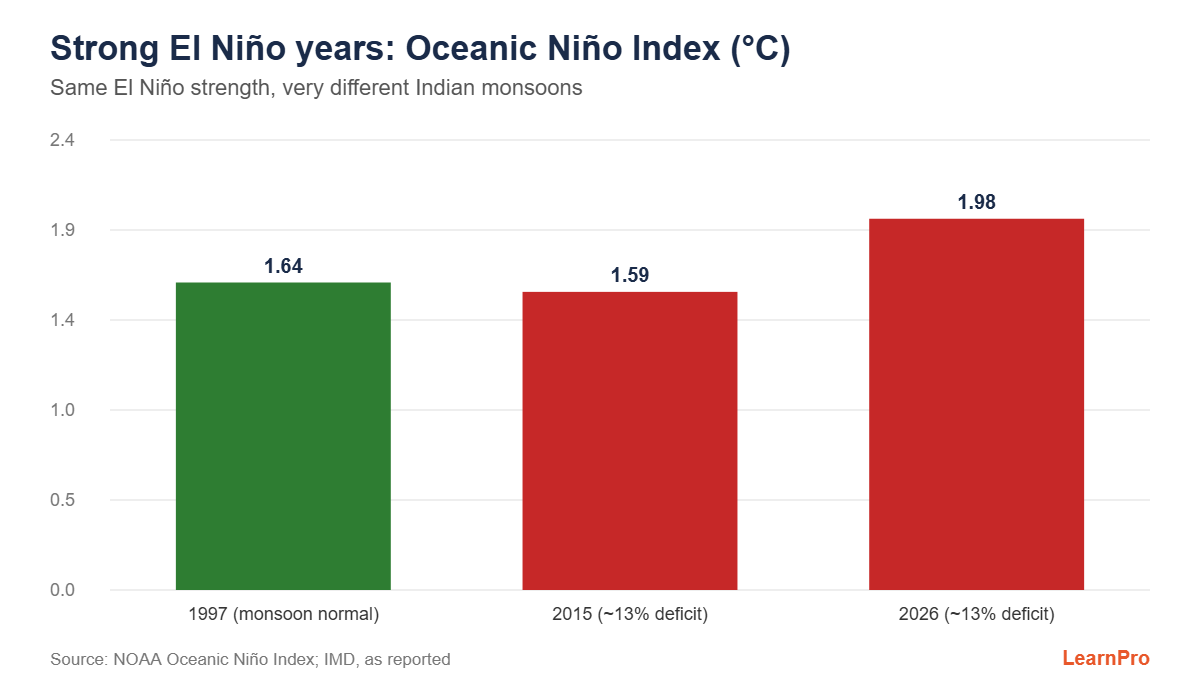
- Seven monsoons since 1950 coincided with a moderate or strong El Niño. In five of them, including 2026, rainfall was at least 10% below the LPA (‘deficient’).
- 2023 was ‘below normal’ but not deficient. Only 1997 was ‘normal’.
- ONI values: 1997 (+1.64°C), 2015 (+1.59°C) and 2026 (+1.98°C). Even so, 2015 had about a 13% deficit.
Why 1997 was Different: Other Monsoon Drivers
- Indian Ocean Dipole (IOD): The difference in sea surface temperature between the western Arabian Sea and the eastern Indian Ocean near Indonesia. A positive IOD (warmer west) increases monsoon rain and can offset El Niño. A strong positive IOD developed in 1997.
- Madden–Julian Oscillation (MJO): An eastward-moving belt of clouds and rain that controls active and break spells.
- Eurasian snow cover: More snow in winter and spring tends to weaken the monsoon.
- Timing of El Niño: Its effect depends on when it develops relative to the monsoon season.
IMD Rainfall Categories (All-India, Seasonal)
| Category | % of LPA |
|---|---|
| Deficient | Below 90 |
| Below normal | 90–95 |
| Normal | 96–104 |
| Above normal | 105–110 |
| Excess | Above 110 |
Implications
- Forecasts must take several drivers into account, not just ENSO. IMD uses dynamic models such as the Monsoon Mission Coupled Forecasting System.
- For agriculture: contingency crop plans, water management for the rabi season, and crop insurance.
- Climate change may be altering the ENSO–monsoon relationship.
Frequently Asked Questions (FAQs)
1. What is the Long Period Average of all-India monsoon rainfall?
About 87 cm (1971–2020 baseline).
2. Which phase of the IOD favours the Indian monsoon?
The positive phase.
3. Which index does NOAA use to measure El Niño?
The Oceanic Niño Index (ONI).
Sources and further reading
- Pierre cb from original by NOAAcommons.wikimedia.org