
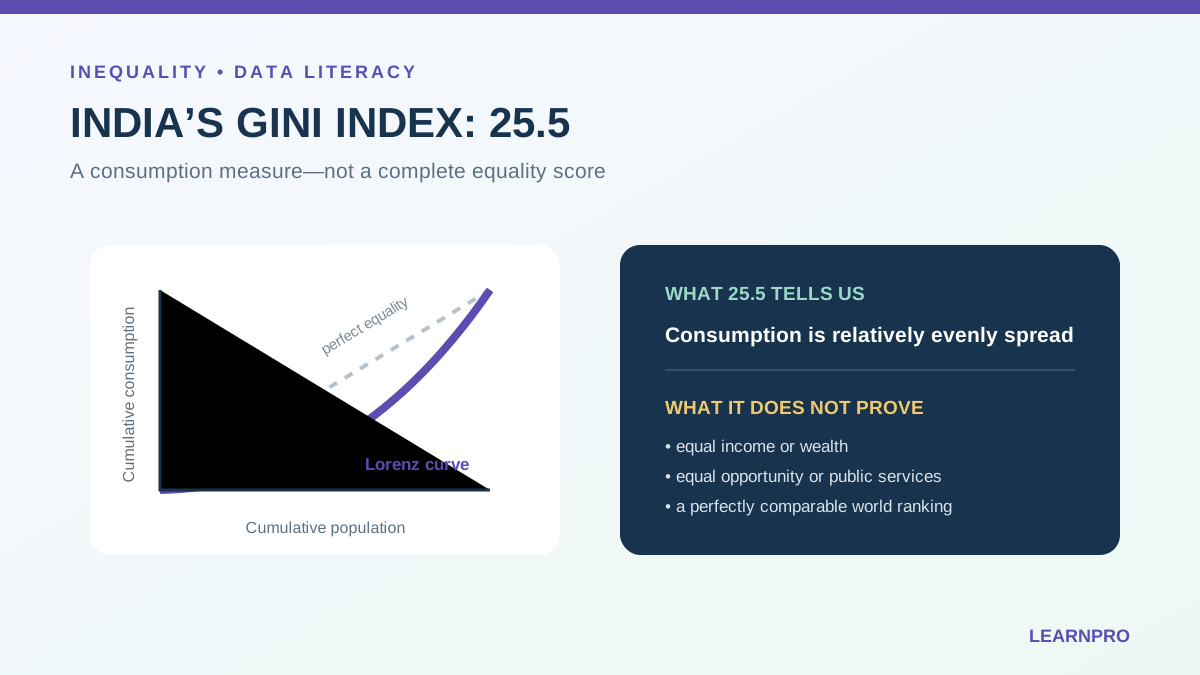
India’s Gini Index was reported by the World Bank at 25.5 for 2022, based on household consumption data. A low Gini coefficient indicates a more even distribution of the measured welfare variable. This led to headlines describing India as the world’s “fourth most equal” country. The number is real, but the global ranking requires careful interpretation.
The Gini estimate measures consumption inequality in a particular survey and year. It is not a complete score for equality of income, wealth, education, health, gender, caste or opportunity. Countries’ latest observations also come from different years and survey methods. For UPSC answers, the correct approach is to acknowledge the improvement while explaining the limits of a league-table claim.
What is the Gini Index?
The Gini Index summarises how unequally a resource is distributed across a population. It ranges from 0 to 100 in the World Bank database:
- 0 represents perfect equality, where everyone has the same measured income or consumption;
- 100 represents perfect inequality, where one unit receives everything; and
- a lower value generally indicates a more equal distribution.
Graphically, the Gini coefficient is related to the gap between the Lorenz curve and the line of perfect equality. The Lorenz curve plots the cumulative share of income or consumption received by successive shares of the population, from poorest to richest.
What does the World Bank data show?
| Indicator | India value | Reference |
|---|---|---|
| Gini Index | 25.51 | World Bank Poverty and Inequality Platform, 2022 |
| Welfare concept | Household consumption | Based on India’s Household Consumption Expenditure Survey |
| Survey period | 2022–23 | World Bank maps the survey to 2022 in its database convention |
| Extreme poverty | World Bank estimates fell sharply over 2011–12 to 2022–23 | Methodology and poverty line must be stated |
The estimate was produced after new official Household Consumption Expenditure Survey data became available. The World Bank published a methodology note and a reproducibility package explaining its welfare aggregate, price adjustments and comparison with 2011–12. This is stronger evidence than an unsupported social-media graphic.
Is India really the fourth most equal country?
Not as a universal or timeless conclusion. If countries are sorted by the latest Gini values currently displayed in a database, India may appear near the low end. But that table does not necessarily compare all countries in the same year using identical welfare concepts.
1. Consumption and income are different
India’s household survey measures consumption expenditure. Many other countries report disposable income. Consumption is usually smoother than income because households borrow, save, share resources or use public services. Consequently, a consumption Gini is often lower than an income Gini and the two should not be treated as directly interchangeable.
2. “Latest value” may mean different years
Household surveys are not conducted simultaneously worldwide. A country’s displayed value may relate to 2024, another to 2022 and another to a much older survey. Ranking them as if they describe the same moment can mislead.
3. Survey design affects measured inequality
Reference periods, item lists, price deflators, treatment of free goods and services, and the ability to capture very rich households all affect estimates. Household surveys commonly under-represent the very top of the distribution.
4. A national average hides group and regional gaps
Two societies can have the same Gini while differing sharply in poverty, social mobility or access to basic services. Within India, rural–urban, state, gender, caste and occupational gaps may persist even when national consumption inequality appears moderate.
Consumption, income and wealth inequality compared
| Measure | What it captures | Important limitation |
|---|---|---|
| Consumption inequality | Differences in household spending or consumption | May understate long-term command over resources |
| Income inequality | Differences in earnings and other income flows | Income can fluctuate and informal earnings are hard to measure |
| Wealth inequality | Distribution of assets minus liabilities | Valuation and ownership data are difficult, especially at the top |
| Opportunity inequality | Access to education, health, networks and mobility | Multidimensional and not reducible to one number |
Why might measured consumption inequality have declined?
A lower consumption Gini may reflect a combination of factors rather than a single scheme:
- rising consumption among households at the lower end of the distribution;
- food support and other social transfers that protect essential consumption;
- improved access to electricity, sanitation, housing, financial accounts and basic services;
- rural infrastructure and connectivity that reduce isolation;
- changes in household size, prices and consumption patterns; and
- survey-method changes that require careful comparability work.
Lower inequality and lower poverty are related but distinct. Poverty asks whether people fall below a threshold; inequality asks how the whole distribution is spread. Read LearnPro’s companion explainer on India’s poverty estimates under the revised global poverty lines.
What does the Gini Index miss?
- Absolute living standards: two countries can have the same Gini but very different average consumption.
- Distribution within households: survey totals may not reveal unequal access by gender or age.
- Public services: free schooling or health care improves welfare but may not be fully represented in cash expenditure.
- Top incomes and wealth: small samples often fail to capture billionaires and complex assets.
- Mobility: the Gini does not show whether people can move up over a lifetime.
- Geography: national figures can hide sharply different state and district outcomes.
How should India measure inequality better?
India needs a dashboard rather than one headline number. The planned national household income survey can add a missing view of earnings, but its questionnaire, non-response treatment and reconciliation with tax and administrative data will be crucial. See the related update on the first national household income survey.
- publish comparable rural, urban, state and social-group distributions;
- combine consumption surveys with income, tax and wealth evidence while protecting privacy;
- release transparent methods, code and sensitivity tests;
- measure access and quality in health, education, housing and digital services;
- track intergenerational mobility and labour-market informality; and
- avoid ranking countries without matching years and welfare concepts.
Policy priorities for substantive equality
A low consumption Gini should not reduce attention to productive jobs, nutrition, learning outcomes and health security. Social protection can prevent deprivation, while sustained equality of opportunity requires capable schools, primary health care, safe cities, affordable housing and access to formal finance. Tax and expenditure policy should be assessed together because both influence distribution.
UPSC and State PSC relevance
India’s Gini Index is relevant to GS Paper II under welfare and social justice, and GS Paper III under inclusive growth, poverty and data. In an answer, define the index, cite 25.5 with the correct year and consumption basis, explain the comparability problem, and propose a multidimensional measurement framework.
Mains practice question: A low Gini coefficient is useful evidence but not a complete certificate of equality. Examine in the context of India’s recent consumption data.
Conclusion
The World Bank’s 25.5 estimate indicates a relatively compressed distribution of measured household consumption and deserves careful attention. It does not by itself prove that India is the world’s fourth most equal society. Responsible analysis separates a valid statistic from an over-broad ranking and examines income, wealth, services and opportunity alongside consumption.
Frequently asked questions
What is India’s latest World Bank Gini Index?
The World Bank’s Poverty and Inequality Platform displays 25.51 for 2022, based on household consumption data.
Does a lower Gini Index mean greater equality?
Yes, for the variable being measured. It does not automatically imply equality in wealth, opportunity or public services.
Why is the “fourth most equal country” claim debatable?
Countries’ observations can come from different years and may measure either income or consumption using different survey methods.
Can poverty fall while inequality rises?
Yes. Poverty and inequality measure different features of a distribution, so they can move in different directions.
Why is consumption inequality often lower than income inequality?
Households smooth consumption through saving, borrowing and transfers, while income can vary sharply over time.
Primary and authoritative references
- World Bank Poverty and Inequality Platform: India
- World Bank methodology note: India poverty trends, 2011–12 to 2022–23
- MoSPI: Household Consumption Expenditure Survey





Sources and further reading
- World Bank Poverty and Inequality Platform: Indiapip.worldbank.org
- World Bank methodology note: India poverty trends, 2011–12 to 2022–23documents.worldbank.org
- MoSPI: Household Consumption Expenditure Surveymospi.gov.in