
India’s National Household Income Survey 2026–27 is the first pan-India household survey designed specifically to measure income and its distribution. The National Statistics Office (NSO), under the Ministry of Statistics and Programme Implementation (MoSPI), is conducting fieldwork from April 2026 to March 2027 through computer-assisted personal interviews.
The survey fills a major statistical gap. India has extensive official data on consumption, employment, assets, debt and national income, but it has not previously published a dedicated all-India household income distribution survey. The NHIS will show how regular income is generated, shared and distributed across households and regions. Results are not yet available because fieldwork is ongoing.
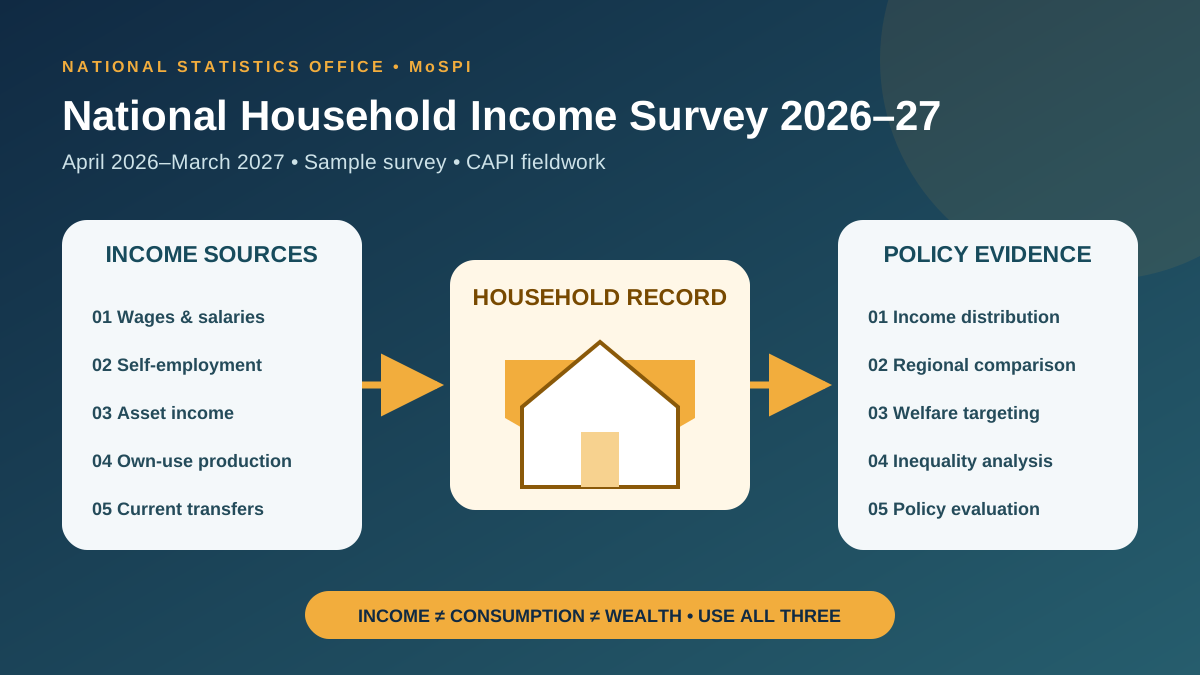
What is the National Household Income Survey?
The National Household Income Survey (NHIS), Schedule NHIS26, collects detailed and disaggregated information on the components of household income. MoSPI’s field instructions define household income as regular monetary or in-kind receipts available for current consumption that do not reduce net worth by selling assets or increasing liabilities.
The survey measures household rather than only personal income because earnings received by individual members are normally shared. It aims to support:
- comparison of income across households and regions;
- analysis of returns to labour, capital and land;
- measurement of inequality and income dispersion;
- design and evaluation of universal and targeted welfare policies; and
- assessment of purchasing power, living conditions and access to essential goods and services.
For the wider official-data context, read LearnPro’s India data quality framework and the guide to the importance of the next Census.
Survey period, coverage and method
| Feature | Official design |
|---|---|
| Fieldwork | April 2026 to March 2027 |
| Implementing body | National Statistics Office, MoSPI |
| Geographical coverage | Whole Indian Union, except villages in Andaman and Nicobar Islands inaccessible throughout the year |
| Data collection | Computer-Assisted Personal Interviewing (CAPI) |
| Sampling design | Multi-stage stratified sample; villages/urban blocks or sub-units are first-stage units and households are ultimate-stage units |
| Sub-rounds | Four three-month periods to spread fieldwork across the year |
The year-long schedule matters because many Indian incomes are seasonal. Agriculture, construction, tourism, bonuses and informal work do not produce identical receipts every month. Distributing the sample across four sub-rounds reduces the risk that a single season dominates the national picture.
What counts as household income?
MoSPI’s design groups income into four broad sources:
- Income from employment: wages, salaries, bonuses and other employment-related receipts.
- Income from self-employment: net income from cultivation, livestock, non-farm businesses and services.
- Income from assets: qualifying receipts from financial and non-financial assets.
- Own-use production and current transfers: specified household services or production for own consumption, remittances, pensions and regular social transfers.
The survey distinguishes gross income from disposable income. Disposable income is calculated after deducting current transfers paid, such as applicable income taxes and certain regular transfers to other households.
What is excluded?
Irregular receipts that change household net worth are not treated as current income. The official instructions exclude examples such as:
- money raised by selling financial or non-financial assets;
- new borrowing;
- capital gains or losses;
- lottery prizes and gambling winnings;
- most non-life insurance claims; and
- one-time legal or injury compensation, except compensation replacing foregone earnings.
This distinction prevents a household from appearing “high income” simply because it sold land, withdrew savings or took a loan during the reference period.
Why income data cannot be replaced by consumption data
India’s Household Consumption Expenditure Survey measures spending, which is often used to study welfare and poverty. But consumption and income answer different questions.
| Measure | What it shows | What it may miss |
|---|---|---|
| Household income | Receipts from work, enterprise, assets and transfers | Reporting errors, hidden income and irregular gains |
| Consumption expenditure | Actual spending and material living standard | Whether spending came from income, savings, credit or asset sales |
| Wealth or assets | Accumulated economic resources | Current cash flow and income volatility |
| National Accounts income | Macro-level income generated in the economy | Direct household-level distribution |
A household may smooth consumption during a bad year by borrowing or using savings. Another may save a large part of a high income. Combining income, consumption and wealth therefore gives a fuller welfare picture. LearnPro’s analysis of poverty estimates based on household consumption explains the complementary role of expenditure data.
How NHIS differs from other major datasets
| Dataset | Primary purpose | Unit or focus |
|---|---|---|
| NHIS | Income sources, distribution and living conditions | Sample households |
| HCES | Household consumption expenditure | Sample households |
| PLFS | Employment, unemployment and labour-force indicators | Persons and households |
| Census | Population and household characteristics | Full population enumeration |
| National Accounts | GDP, sectoral output and macro aggregates | Economy-wide accounts |
| Tax and administrative data | Programme or legal records | Covered taxpayers, firms or beneficiaries |
No single source is a universal truth. Surveys can cover informal and non-taxed activity but face recall and non-response errors. Administrative records are precise for covered transactions but omit people and incomes outside their systems. National Accounts provide macroeconomic consistency but do not directly reveal distribution among households.
Why previous attempts did not become a regular series
MoSPI notes that experimental household-income questions appeared in the 9th NSS round in 1955 and the 14th round in 1958–59, but estimates were not released. Receipt-and-disbursement data were later collected in the 19th and 24th rounds. The efforts were not continued because income is difficult to measure reliably in the field.
The 2026–27 initiative was preceded by a Technical Expert Group chaired by economist Surjit S. Bhalla. The group advised on concepts, definitions, sampling, estimation and international practice. NSO also pre-tested the draft schedule in August 2025 across 15 regional offices, using rural and urban localities and households from different income groups.
Main measurement challenges
1. Informal and self-employment income
A salaried employee may have a payslip, but a farmer, shopkeeper or gig worker often mixes business and household accounts. Estimating revenue, operating cost, own consumption and depreciation requires detailed questioning.
2. Recall error
Respondents may not remember irregular wages, bonuses, crop sales or transfers over a long reference period. Different components therefore need appropriate recall periods and consistency checks.
3. Non-response and under-reporting
Income is sensitive. High-income households may be difficult to contact or reluctant to disclose assets and receipts, while vulnerable households may fear loss of benefits. If non-response is concentrated in particular groups, inequality can be underestimated.
4. In-kind and own-use income
Farm produce consumed by the household, employer-provided benefits and imputed services need valuation rules. Poor valuation can make rural and urban incomes hard to compare.
5. Seasonality and income volatility
A yearly total may hide months with no earnings. Policy analysis should study both average income and volatility, because two households with the same annual total can face very different insecurity.
6. Survey–macro gap
Household survey totals may differ from household-sector income in National Accounts because the concepts, coverage and data sources differ. Reconciliation should be transparent rather than forcing both systems to produce identical totals.
Potential policy uses
- Inequality: estimate shares, percentiles and measures such as the Gini coefficient.
- Welfare targeting: identify groups that need universal or targeted support, with safeguards against mechanical exclusion.
- Labour policy: compare returns to salaried work, casual labour and self-employment.
- Regional development: examine state, rural–urban and occupational differences.
- Fiscal analysis: study taxes and transfers across the income distribution.
- Gender analysis: assess who earns income and how household resources are shared, while recognising that household totals do not prove equal control within families.
- National Accounts and prices: provide evidence for macroeconomic estimation and analytical work, subject to methodological reconciliation.
Privacy, consent and responsible use
Income records are sensitive personal data. NSO should minimise collection to statistical need, secure CAPI devices and transfers, restrict access, anonymise released microdata and publish disclosure-control methods. Survey answers should be used for statistics, not treated as unverified evidence for tax enforcement or denial of benefits.
Respondents also need a clear explanation of the survey’s purpose, official identification of enumerators and a way to verify field staff. Trust directly affects data quality.
How to judge the eventual NHIS report
When results are released, readers should examine:
- sample size, response rate and coverage of high-income households;
- definitions of gross, disposable, cash and in-kind income;
- reference periods used for each income source;
- weighting, imputation and treatment of zero or negative self-employment income;
- sampling and non-sampling error;
- comparability across states and rural–urban areas; and
- reconciliation with HCES, PLFS, tax data and National Accounts.
Until the report is published, claims about India’s income Gini, median household income or state rankings cannot be attributed to NHIS.
UPSC relevance
The National Household Income Survey 2026 links GS-II welfare governance with GS-III inclusive growth and official statistics. A good Mains answer should explain why income, consumption and wealth are distinct; describe measurement challenges; and recommend transparency, privacy protection and data triangulation.
Conclusion
NHIS is an important institutional step, not an instant inequality answer. Its value will depend on representative sampling, honest responses, careful valuation of informal and in-kind income, transparent methods and responsible use. If these conditions are met, India will gain a stronger evidence base for judging who benefits from growth and how policy can improve household economic security.
Frequently asked questions
What is the National Household Income Survey 2026?
It is the first dedicated pan-India NSO survey designed to measure household income sources, distribution and living conditions.
When is NHIS being conducted?
Official field instructions specify a survey period from April 2026 to March 2027, divided into four three-month sub-rounds.
What income does NHIS include?
It includes regular income from employment, self-employment, assets, specified own-use production and current transfers received by household members.
Is a loan counted as household income?
No. Borrowing increases liabilities and is excluded from current household income. Receipts from selling assets and most one-time windfalls are also excluded.
Have NHIS results been released?
No. As of July 2026, the year-long fieldwork is in progress. National or state income estimates cannot yet be claimed as NHIS findings.
Official references
- MoSPI: National Household Income Survey 2026 documents
- NSO: NHIS field instructions, concepts and design
- PIB: launch preparation and April 2026 fieldwork