Brief Context
Context According to the World Bank’s Poverty and Equity Briefs (PEBs), Indias extreme poverty dropped significantly from 16% in 2011–12 to 2.3% in 2022–23, marking major progress in poverty reduction. About the Poverty and Equity Briefs (PEBs) They are biannual reports by the World Bank and provide a quick overview of poverty, inequality, and shared prosperity trends in over 100 developing countries. It is released during the Spring and Annual Meetings of the World Bank and IMF, they aim to kee
Source Content
Syllabus :GS 3/Economy
Context
- According to the World Bank’s Poverty and Equity Briefs (PEBs), India’s extreme poverty dropped significantly from 16% in 2011–12 to 2.3% in 2022–23, marking major progress in poverty reduction.
About the Poverty and Equity Briefs (PEBs)
- They are biannual reports by the World Bank and provide a quick overview of poverty, inequality, and shared prosperity trends in over 100 developing countries.
- It is released during the Spring and Annual Meetings of the World Bank and IMF, they aim to keep poverty reduction central on the global agenda.
Measurement
- Poverty rates and total number of poor as measured by the national poverty line and for the international extreme poverty line ($2.15 in 2017 PPP terms), as well as the lower-middle-income ($3.65) and upper-middle-income ($6.85) poverty lines.
- Comparable poverty and inequality trends for apples-to-apples comparisons over time and across countries.
- Multidimensional poverty measure, including measures of poverty that also reflect non-monetary deprivations that poor people face in areas like education and access to basic services.
- Inequality as measured by the Gini Index.
Recent Findings for India
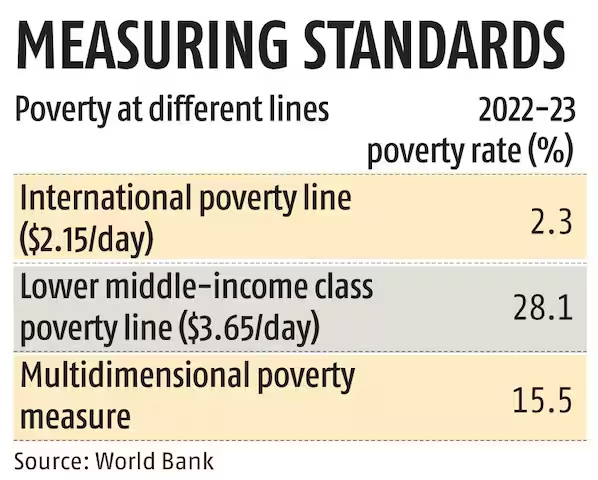
- India has made significant progress in reducing poverty, with extreme poverty — measured at $2.15 per day in purchasing power parity (PPP) terms — falling from 16 per cent in 2011–12 to 2.3 per cent in 2022–23
- The decline lifted 171 million people above the internationally comparable poverty line.
- Rural extreme poverty declined from 18.4% to 2.8%, and urban from 10.7% to 1.1%, narrowing the rural-urban gap significantly.
- Using the $3.65/day lower-middle-income countries (LMIC) poverty line, poverty dropped from 61.8% to 28.1%, with 378 million people moving above the threshold.
- The World Bank’s multidimensional poverty index (MPI), which includes extreme poverty but excludes nutrition and health deprivation, showed that non-monetary poverty declined from 53.8 per cent in 2005–06 to 16.4 per cent in 2019–21, and further to 15.5 per cent in 2022–23.
- India’s five most populous states — Uttar Pradesh, Maharashtra, Bihar, West Bengal, and Madhya Pradesh — accounted for 54 per cent of the country’s extreme poor in 2022–23 and 51 per cent of its multidimensionally poor in 2019–21.
- These states had contributed 65 per cent of the extreme poor in 2011–12 and drove two-thirds of the overall decline by 2022–23.
- Despite improvements, wage inequality is high, the top 10% earn 13 times more than the bottom 10%.
- The Gini index based on consumption improved (28.8 to 25.5), but income inequality rose (Gini from 52 to 62).
- Youth unemployment stands at 13.3%, rising to 29% among graduates, with most jobs remaining informal, particularly in agriculture.
- Female employment remains low at 31% with a 234 million gap compared to men, though overall employment has been growing since 2021–22.
| Do you know ? – Gini index is a measure of income inequality within a population, ranging from 0 to 1, where 0 represents perfect equality and 1 represents perfect inequality. |
Source :BS