
India’s agriculture and allied sectors output has grown steadily, but its internal composition is changing. The National Statistics Office’s Statistical Report on Value of Output from Agriculture and Allied Sectors (2011–12 to 2023–24) shows that crops remain the largest component, while livestock, fisheries, horticulture and other high-value activities are becoming increasingly important.
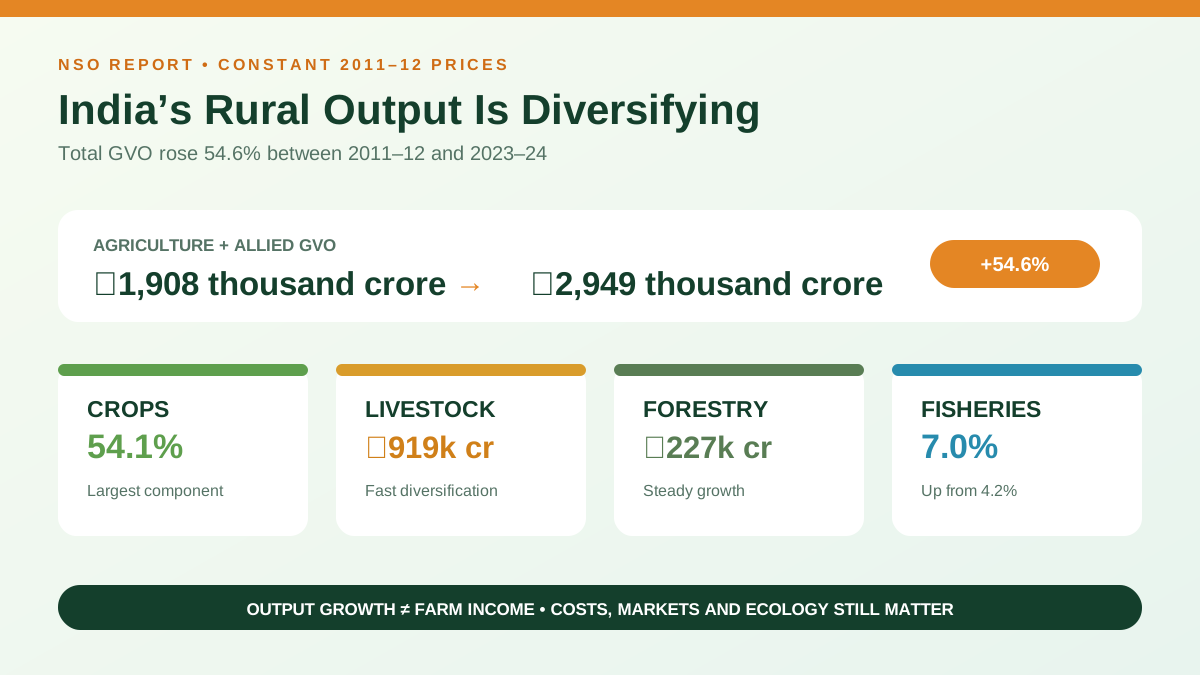
At constant 2011–12 prices, the sector’s Gross Value of Output (GVO) rose from ₹1,908 thousand crore in 2011–12 to ₹2,949 thousand crore in 2023–24—an increase of about 54.6%. The report gives item-wise and State-wise evidence needed to understand agricultural diversification rather than treating “agriculture” as foodgrains alone.
What did the NSO report measure?
The National Statistics Office (NSO), under the Ministry of Statistics and Programme Implementation (MoSPI), released the report on 27 June 2025. It provides annual estimates from 2011–12 to 2023–24 for four broad activities:
- crops;
- livestock;
- forestry and logging; and
- fishing and aquaculture.
Values are presented at both current prices and constant 2011–12 prices. The publication complements the aggregate estimates in the National Accounts Statistics by providing detailed commodity and State-level tables.
GVO and GVA are not the same
| Measure | Meaning | Use |
|---|---|---|
| Gross Value of Output (GVO) | Total value of goods and services produced before deducting intermediate inputs | Shows the scale and composition of production |
| Intermediate consumption | Inputs used up in production, such as feed, seed, fertiliser, fuel and services | Explains why high output does not equal the same amount of income |
| Gross Value Added (GVA) | GVO minus intermediate consumption | Measures the sector’s contribution to the economy |
A dairy enterprise may have a large value of milk output but also spend heavily on feed, veterinary services and energy. Its GVA is therefore lower than its GVO. UPSC answers should not use the two measures interchangeably.
Current prices versus constant prices
Current-price estimates use prices prevailing in each year. They capture both changes in physical production and changes in prices. Constant-price estimates value output using a fixed base year—in this report, 2011–12—so they are better for assessing real changes in output over time.
The report states that agriculture and allied GVA at current prices increased about 225%, from ₹1,502 thousand crore in 2011–12 to ₹4,878 thousand crore in 2023–24. This does not mean real production grew by 225%; much of the current-price rise reflects inflation. The constant-price GVO increase of 54.6% gives a more meaningful view of production growth, though it is a different aggregate from GVA.
Key figures from the 2023–24 report
| Indicator at constant 2011–12 prices | 2011–12 | 2023–24 | Change or significance |
|---|---|---|---|
| Total agriculture and allied GVO | ₹1,908 thousand crore | ₹2,949 thousand crore | 54.6% overall increase |
| Crop GVO | — | ₹1,595 thousand crore | 54.1% of total GVO |
| Livestock products GVO | ₹488 thousand crore | ₹919 thousand crore | One of the fastest-growing components |
| Forestry and logging GVO | ₹149 thousand crore | ₹227 thousand crore | Moderate, consistent growth |
| Fishing and aquaculture share | 4.2% of total GVO | 7.0% of total GVO | Strong increase in structural importance |
| Floriculture GVO | ₹17.4 thousand crore | ₹28.1 thousand crore | Commercial diversification |
Crop sector: still the largest, but more diverse
The crop sector contributed ₹1,595 thousand crore, or 54.1% of total agriculture and allied GVO, in 2023–24. Cereals and fruits and vegetables together accounted for 52.5% of crop GVO. This shows the continuing weight of staples alongside the rising value of horticulture.
Cereals remain concentrated
Paddy and wheat alone formed about 85% of the GVO of all cereals in 2023–24. Five States—Uttar Pradesh, Madhya Pradesh, Punjab, Telangana and Haryana—contributed nearly 53% of cereal GVO. Uttar Pradesh remained first, although its share declined from 18.6% in 2011–12 to 17.2% in 2023–24.
This concentration reflects procurement systems, irrigation, established varieties and food demand. It also exposes production to water stress, climate risk and regional imbalances. Diversification policy must protect food security while reducing ecological dependence on a narrow crop mix.
Horticulture is changing the value map
- Banana: its constant-price GVO reached ₹47.0 thousand crore in 2023–24, slightly exceeding mango at ₹46.1 thousand crore. Mango had led consistently until 2021–22.
- Potato: remained the largest contributor within the vegetable group; GVO rose from ₹21.3 thousand crore to ₹37.2 thousand crore.
- Floriculture: GVO increased from ₹17.4 thousand crore to ₹28.1 thousand crore.
- Condiments and spices: Madhya Pradesh led in 2023–24 with 19.2%, followed by Karnataka at 16.6% and Gujarat at 15.5%.
Horticulture can generate more value per hectare and create jobs in grading, cold storage, processing and transport. However, perishability and price volatility mean that output growth must be matched by supply-chain infrastructure.
Livestock: the strongest diversification engine
Livestock-products GVO increased from ₹488 thousand crore in 2011–12 to ₹919 thousand crore in 2023–24 at constant prices—an increase of about 88%. Livestock offers regular cash flow, uses crop residues and can support small and land-poor households.
Milk remained dominant, but its share of livestock GVO declined from 67.2% to 65.9%. The meat group’s share rose from 19.7% to 24.1%. The change indicates diversification within livestock, including poultry and small-ruminant value chains.
Rapid livestock growth also raises policy challenges:
- availability and price of nutritious feed and fodder;
- animal disease surveillance and vaccination;
- veterinary services and breed improvement;
- milk chilling, hygienic slaughter and cold-chain systems;
- methane emissions and waste management; and
- fair prices for small producers within organised supply chains.
Fisheries and aquaculture: a rising share
The share of fishing and aquaculture in total agriculture and allied GVO rose from 4.2% in 2011–12 to 7.0% in 2023–24. Within fisheries GVO, the share of inland fish declined from 57.7% to 50.2%, while marine fish rose from 42.3% to 49.8%.
This does not mean inland output necessarily fell; it means the composition shifted as marine fisheries’ value grew faster. State-level contributions also changed, particularly in major producers such as Andhra Pradesh and West Bengal.
LearnPro’s detailed guide to the Pradhan Mantri Matsya Sampada Yojana and fisheries value chain explains the infrastructure and governance side of this transition.
Forestry and logging: steady growth, changing composition
Forestry and logging GVO increased from ₹149 thousand crore to ₹227 thousand crore. Industrial wood’s share within the sector rose from 49.9% to 70.2%. This can reflect demand for timber, paper, panels and other wood-based products, but output value is not itself a measure of ecological sustainability.
National accounts record market and imputed production. They do not fully capture ecosystem services such as carbon storage, soil conservation, biodiversity, watershed protection and cultural value. Forest-output policy must therefore be read with forest-condition and biodiversity data rather than interpreted as a simple production target.
What does the report reveal about structural transformation?
- Agriculture is no longer synonymous with cereals: livestock, fisheries, fruits, vegetables, spices and flowers form a growing share of rural output.
- Demand is shifting: rising incomes and urbanisation increase demand for milk, eggs, meat, fish, fruits and processed food.
- Farm income can become less seasonal: dairying, poultry and aquaculture produce more frequent cash flows than one or two crop harvests.
- Value chains matter more: high-value perishables need cold storage, testing, transport, processing and reliable markets.
- Regional production patterns are changing: States are specialising in different commodities based on climate, infrastructure and market access.
- Climate resilience is mixed: diversification can spread risk, but livestock heat stress, fish disease and horticultural perishability create new vulnerabilities.
What the report does not prove
Production statistics should not be stretched beyond their purpose. Higher GVO does not automatically establish:
- higher real farmer income, because input costs and distribution of returns matter;
- better nutrition, because affordability and household access matter;
- greater employment, because some value chains are capital-intensive;
- environmental sustainability, because water use, emissions and biodiversity are not deducted from GVO; or
- lower inequality, because aggregate output can rise while small producers receive a small share.
GVO data should be combined with Situation Assessment Survey data, agricultural wages, cost-of-cultivation estimates, terms of trade, nutrition indicators and natural-resource accounts.
Policy priorities
- Move from crop policy to rural-production policy: integrate crops, livestock, fisheries, agroforestry and processing at district level.
- Invest in perishables infrastructure: pack houses, reefer transport, milk chilling, fish landing centres and local processing.
- Strengthen producer organisations: FPOs and cooperatives can aggregate small quantities, improve quality and negotiate prices.
- Manage biological risks: build veterinary, fish-health and plant-disease surveillance with rapid laboratory capacity.
- Correct water incentives: encourage crop choices suited to agro-climatic conditions without abrupt withdrawal of farmer support.
- Improve price and output data: publish timely district-level physical quantities, prices, costs and producer shares.
- Link diversification with nutrition: public procurement and local food programmes can create stable demand for pulses, millets, eggs and horticulture.
- Measure natural-capital costs: supplement national accounts with water, soil, forest and emissions indicators.
The policy logic is reflected in LearnPro’s explainer on integrated farming models for small farmers.
UPSC and State PSC relevance
Agriculture and allied sectors output is relevant to GS Paper III—agriculture, economics, food security and inclusive growth. Prelims candidates should distinguish GVO from GVA and constant prices from current prices. In Mains, use the figures to show that crops remain dominant but livestock and fisheries are driving diversification.
Mains practice: The growth of India’s allied sectors represents both an income-diversification opportunity and a new infrastructure challenge. Discuss using the NSO’s agriculture output report.
Conclusion
The NSO report records a real expansion of India’s agriculture and allied output and a clear change in its composition. Crops still account for more than half of GVO, yet the faster rise of livestock and fisheries shows where rural demand, enterprise and value addition are moving. Policy must now build resilient value chains and measure producer income and ecological cost—not celebrate output value alone.
Frequently asked questions
What was India’s agriculture and allied GVO in 2023–24?
At constant 2011–12 prices, GVO was ₹2,949 thousand crore, up from ₹1,908 thousand crore in 2011–12.
What is the difference between GVO and GVA?
GVO is the total value of output before deducting inputs. GVA is GVO minus intermediate consumption and measures value added to the economy.
Which was the largest agriculture component?
Crops remained largest with ₹1,595 thousand crore and a 54.1% share of total agriculture and allied GVO in 2023–24.
How important was livestock?
Livestock-products GVO rose from ₹488 thousand crore in 2011–12 to ₹919 thousand crore in 2023–24 at constant prices.
Did fisheries gain share?
Yes. Fishing and aquaculture increased from 4.2% of total agriculture and allied GVO in 2011–12 to 7.0% in 2023–24.