
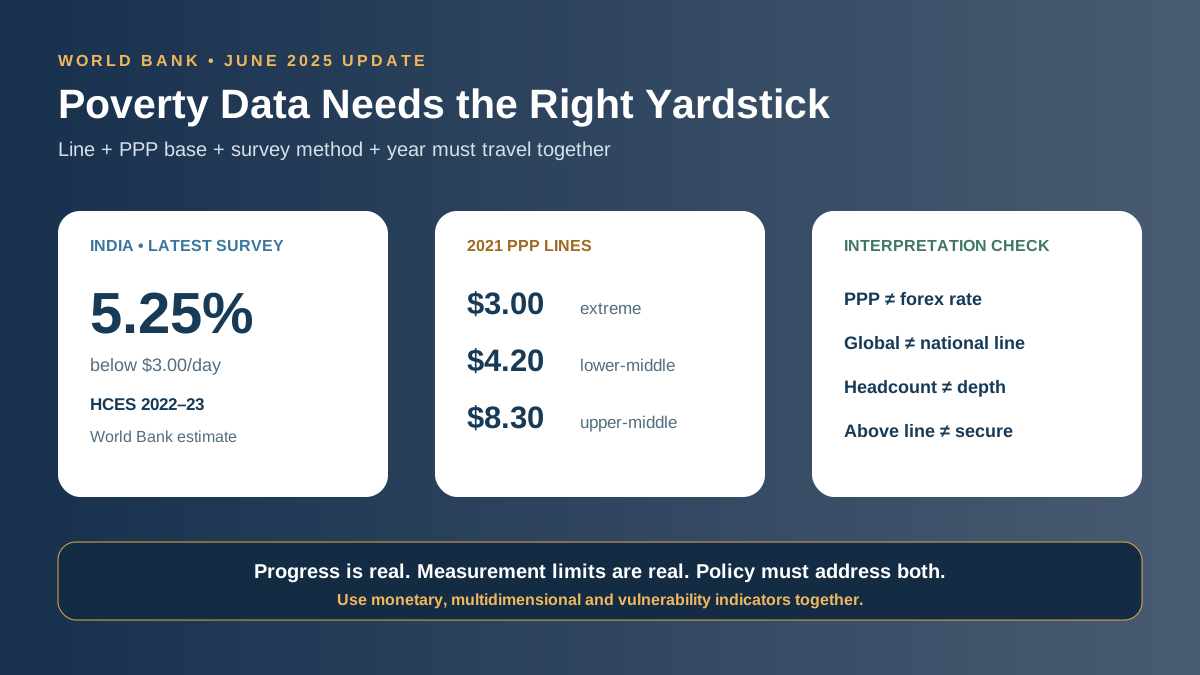
The World Bank’s June 2025 revision placed the India poverty estimate at about 5.25% below $3.00 a day, using 2021 purchasing power parity (PPP) and India’s 2022–23 household consumption survey. This does not mean the poverty line was simply raised from $2.15 to $3 at the market exchange rate. The PPP base, underlying global benchmark and Indian survey data were all updated together.
The result is important: extreme monetary poverty has fallen sharply, but India still faces substantial deprivation at higher middle-income poverty lines and across health, nutrition, education, housing and secure employment.
What changed in June 2025?
The World Bank adopted the International Comparison Program’s 2021 PPPs and updated the global poverty lines derived from national poverty standards. The extreme-poverty line typical of low-income countries became $3.00 per person per day in 2021 PPP.
| Global benchmark | Previous line (2017 PPP) | New line (2021 PPP) | Purpose |
|---|---|---|---|
| International/extreme poverty | $2.15 | $3.00 | Standard typical of low-income countries |
| Lower-middle-income line | $3.65 | $4.20 | More demanding benchmark for lower-middle-income economies |
| Upper-middle-income line | $6.85 | $8.30 | Benchmark typical of upper-middle-income economies |
The World Bank stresses that the international line supports global comparison and SDG monitoring. A country’s own national poverty line is normally more appropriate for domestic policy dialogue and benefit targeting because it reflects that country’s needs and institutions.
What is purchasing power parity?
PPP is a conversion factor that equalises the purchasing power of currencies by accounting for differences in price levels. An “international dollar” is not a US banknote converted at the market exchange rate. It represents the quantity of goods and services that one US dollar could buy in the United States in the reference year.
Therefore, multiplying $3 by the daily rupee–dollar exchange rate gives the wrong Indian poverty threshold. PPP conversion uses a comparative price basket, while market exchange rates respond to capital flows, interest rates and currency markets.
India’s revised estimate
The World Bank Poverty and Inequality Platform reports an Indian poverty rate of about 5.25% at $3.00 a day for the latest survey year. This estimate incorporates the Household Consumption Expenditure Survey (HCES) 2022–23.
Three changes explain why new estimates differ from earlier publications:
- 2021 PPPs replaced 2017 PPPs for headline reporting;
- global poverty lines were recalculated from updated national poverty lines; and
- new Indian consumption data replaced extrapolation from much older survey information.
At the global level, the new system raised the estimated number of people in extreme poverty in 2022 from 713 million to 838 million—an upward revision of about 125 million. South Asia was the exception: its estimate was revised downward, mainly because India’s new household survey showed higher measured consumption than previously inferred.
Why survey method matters
India’s consumption surveys have used different recall periods. Under the older Uniform Reference Period (URP), households generally reported consumption over the previous 30 days. The Modified Mixed Reference Period (MMRP) asks about:
- the previous 7 days for frequently purchased perishables;
- the previous 365 days for selected low-frequency items; and
- the previous 30 days for remaining items.
The HCES 2022–23 collected MMRP data, while much of the historic World Bank series had relied on URP-compatible welfare aggregates. The Bank therefore adjusted the historic series to improve comparability and removed certain non-comparable interim estimates. A fall in the published poverty rate can reflect genuine welfare improvement, better data and methodological alignment; analysts must identify each contribution.
How is poverty measured?
For a monetary poverty line z, the simplest measure is the headcount ratio:
Headcount ratio = number of people below the poverty line ÷ total population
It is easy to communicate but does not show how far below the line poor households are. The poverty gap measures the average shortfall from the line. The squared poverty gap gives greater weight to the poorest. Good policy needs all three because two regions with the same headcount can have very different depth and severity of poverty.
Why extreme poverty is not the whole story
Higher poverty lines
India is a lower-middle-income country, so the $4.20 line is a useful complementary benchmark. A household above $3 may still be highly vulnerable to a health emergency, crop loss, job loss or food-price shock.
Multidimensional deprivation
Income or consumption cannot fully capture nutrition, child mortality, schooling, sanitation, drinking water, electricity, housing and assets. The Multidimensional Poverty Index examines overlapping deprivations. Monetary and multidimensional measures should complement, not replace, one another.
Distribution and vulnerability
A national average can hide rural–urban, state, gender, caste, tribal and occupational differences. It also does not reveal informal work, indebtedness or the risk of falling back below the line.
Common mistakes in interpreting the data
- Comparing unlike PPP series: $2.15 in 2017 PPP and $3 in 2021 PPP are not directly comparable nominal-dollar amounts.
- Using market exchange rates: PPP dollars cannot be converted with the current forex rate.
- Calling the estimate India’s official national line: it is a World Bank global benchmark.
- Ignoring survey design: recall period and consumption aggregate affect measured welfare.
- Equating “above extreme poverty” with economic security: many households remain close to the threshold.
- Reading revision as overnight change: new data can revise the historical picture without households suddenly becoming richer on publication day.
Policy implications for India
- Institutionalise frequent HCES rounds so poverty estimates do not depend on decade-old consumption data.
- Publish transparent national measures with methods, price indices and state-level results open to scrutiny.
- Track vulnerability at more than one poverty line and examine poverty gaps, not only headcounts.
- Improve human capabilities through nutrition, learning, primary healthcare, water and sanitation.
- Create productive employment because durable poverty reduction depends on wages, skills and enterprise productivity.
- Protect households from shocks through social insurance, portable benefits, disaster resilience and responsive safety nets.
- Use disaggregated data to reach groups and districts that national averages conceal.
UPSC and State PSC relevance
The India poverty estimate connects GS Paper II welfare and social justice with GS Paper III inclusive growth, data and human development. In Prelims, distinguish PPP from exchange rates and global from national poverty lines. In Mains, combine monetary poverty, multidimensional deprivation, vulnerability and survey-method limitations.
Mains practice question: India’s decline in extreme poverty is significant, but a single global poverty line cannot describe the full extent of deprivation and vulnerability. Discuss.
Conclusion
The revised World Bank series provides strong evidence of long-term progress against extreme monetary poverty. It also illustrates why poverty statistics require careful reading. The correct policy message is neither to dismiss the decline nor to declare deprivation solved. India needs frequent transparent surveys, multiple poverty measures and public services that convert higher consumption into secure human development.
Frequently asked questions
What is the new World Bank extreme-poverty line?
It is $3.00 per person per day in 2021 PPP international dollars, replacing $2.15 in 2017 PPP for headline global reporting.
What is India’s poverty rate at the new line?
The World Bank Poverty and Inequality Platform reports about 5.25% for the latest Indian survey year using the $3 line.
Can $3 be converted using the market exchange rate?
No. It is a PPP international dollar that accounts for cross-country price differences, not a current US dollar exchanged in the currency market.
Why did India’s estimate change?
The 2021 PPP base, global poverty lines and underlying Indian HCES 2022–23 consumption data were all updated.
Is $3 the best line for Indian welfare policy?
It is useful for global comparison. National policy should also use a transparent domestic line, the $4.20 lower-middle-income benchmark, multidimensional indicators and vulnerability measures.
Primary references
- World Bank: June 2025 update to global poverty lines
- World Bank Poverty and Inequality Platform: India
- World Bank reproducibility package: India poverty trends, 2011–12 to 2022–23
- MoSPI: Household Consumption Expenditure Survey 2022–23





Sources and further reading
- World Bank: June 2025 update to global poverty linesworldbank.org
- World Bank Poverty and Inequality Platform: Indiapip.worldbank.org
- World Bank reproducibility package: India poverty trends, 2011–12 to 2022–23reproducibility.worldbank.org
- MoSPI: Household Consumption Expenditure Survey 2022–23mospi.gov.in