
The Jharkhand Population Statistics (2011) provide comprehensive insights into the state’s demographic diversity, growth patterns, literacy rates, and social composition. These statistics are vital for analyzing socio-economic development, policy formulation, and understanding regional disparities, making them a significant topic for General Studies papers.
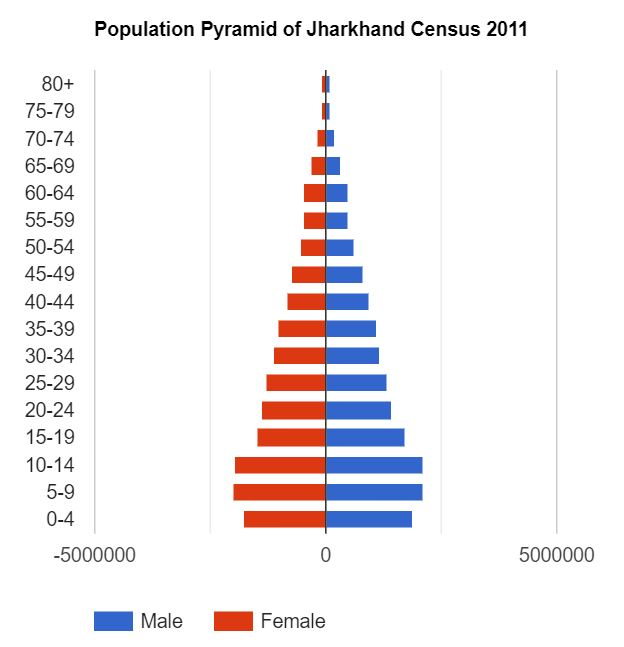
Jharkhand Population Snapshot (2011 Census)
The 2011 Census data offers a detailed overview of Jharkhand’s population, highlighting its position nationally and key demographic indicators.
| Category | Value |
|---|---|
| Total Population (2011) | 32,988,134 |
| Total Population (2001) | 26,945,829 |
| Percentage of National Population | 2.72% |
| National Rank by Population | 14th |
| Population Density (2011) | 414 persons per sq. km |
| Overall Gender Ratio (2011) | 949 females per 1000 males |
| Overall Child Gender Ratio (0-6 years, 2011) | 948 females per 1000 males |
| Overall Literacy Rate (2011) | 66.41% |
| Decadal Growth Rate (2001-2011) | 22.42% |
| Scheduled Tribes (ST) Population | 26.20% |
| Scheduled Castes (SC) Population | 12.08% |
| Rural Population | 75.95% |
| Urban Population | 24.05% |
Get all JPSC Notes https://learnpro.in/jpsc-notes/

Demographic Composition and Growth Trends
Jharkhand’s population is characterized by a significant rural presence and a notable proportion of tribal communities. Understanding its classification and growth patterns is essential for socio-economic analysis.
Jharkhand Population Classification (2011)
| Classification | Population | Percentage of Total Population |
|---|---|---|
| Male Population | 16,930,315 | 51.32% |
| Female Population | 16,057,819 | 48.68% |
| Rural Population | 25,055,073 | 75.95% |
| Urban Population | 7,933,061 | 24.05% |
| Scheduled Castes (SC) | 3,985,644 | 12.08% |
| Scheduled Tribes (ST) | 8,645,042 | 26.20% |
| Minority Population | – | 19.12% |
| Population (0-6 Age) | 5,389,595 | 16.33% |
Workforce Distribution (2011)
The state’s workforce data provides insights into economic participation and gender distribution within the labor force.
| Category | Number |
|---|---|
| Total Workers | 13,098,274 |
| Male Workers | 8,424,769 |
| Female Workers | 4,673,505 |
Decadal Jharkhand Population Growth Rate (2001-2011)
Jharkhand recorded a decadal growth rate of 22.42% between 2001 and 2011, ranking 10th nationally. This indicates a significant increase in population over the decade, though it was slightly lower than the 23.3% recorded in 2001. The highest decadal growth rate for Jharkhand was 24% during 1981-1991.
Districts with Highest Decadal Population Growth Rate (2001-2011)
| Rank | District | Population Growth (%) |
|---|---|---|
| 1 | Koderma | 43.42% |
| 2 | Chatra | 31.77% |
| 3 | Giridih | 28.40% |
| 4 | Pakur | 28.33% |
| 5 | Deoghar | 28.03% |
Districts with Lowest Decadal Population Growth Rate (2001-2011)
| Rank | District | Population Growth (%) |
|---|---|---|
| 1 | Dhanbad | 11.99% |
| 2 | East Singhbhum | 15.68% |
| 3 | Simdega | 16.01% |
| 4 | Ramgarh/Hazaribagh | 17.85% |
| 5 | Jamtara/Dumka | 20.05% |
Population Density and Gender Ratios
Population density reflects the distribution of people across the state’s geographical area, while gender ratios are crucial indicators of social health and demographic balance.
Jharkhand Population Density (2011)
Jharkhand’s population density was 414 persons per square kilometer in 2011, an increase from 338 in 2001. The state ranked 14th nationally in terms of population density.
Districts with Highest Population Density (2011)
| Rank | District | Population Density (persons per sq. km) |
|---|---|---|
| 1 | Dhanbad | 1,316 |
| 2 | Bokaro | 715 |
| 3 | Deoghar | 708 |
| 4 | East Singhbhum | 644 |
| 5 | Deoghar | 602 |
Districts with Lowest Population Density (2011)
| Rank | District | Population Density (persons per sq. km) |
|---|---|---|
| 1 | Simdega | 157 |
| 2 | Latehar | 169 |
| 3 | Gumla | 191 |
| 4 | West Singhbhum | 208 |
| 5 | Khunti | 210 |
Gender Ratio Overview (2011)
The overall gender ratio in Jharkhand was 949 females per 1000 males in 2011, an improvement from 941 in 2001. The state ranked 17th nationally for its gender ratio.
| Classification | Gender Ratio (2011) | Gender Ratio (2001) |
|---|---|---|
| Rural Gender Ratio | 961 | 962 |
| Urban Gender Ratio | 910 | 870 |
| Gender Ratio among SC | 950 | – |
| Gender Ratio among ST | 1003 | – |
Districts with Highest Gender Ratio (2011)
| Rank | District | Gender Ratio (females per 1000 males) |
|---|---|---|
| 1 | West Singhbhum | 1005 |
| 2 | Simdega | 997 |
| 3 | Khunti | 997 |
| 4 | Gumla | 992 |
| 5 | Pakur | 989 |
Districts with Lowest Gender Ratio (2011)
| Rank | District | Gender Ratio (females per 1000 males) |
|---|---|---|
| 1 | Dhanbad | 909 |
| 2 | Ramgarh | 921 |
| 3 | Bokaro | 921 |
| 4 | Ranchi | 923 |
| 5 | Palamu | 928 |
Child Gender Ratio (0-6 Years, 2011)
The overall child gender ratio in Jharkhand was 948 females per 1000 males in 2011, a decrease from 965 in 2001, indicating a concerning trend.
| Classification | Child Gender Ratio (2011) | Child Gender Ratio (2001) |
|---|---|---|
| Rural Child Gender Ratio | 957 | 973 |
| Urban Child Gender Ratio | 904 | 930 |
| Child Gender Ratio among SC | 984 | – |
| Child Gender Ratio among ST | 979 | – |
Districts with Highest Child Gender Ratio (2011)
| Rank | District | Child Gender Ratio |
|---|---|---|
| 1 | West Singhbhum | 983 |
| 2 | Simdega | 975 |
| 3 | Lohardaga | 970 |
| 4 | Simdega | 969 |
| 5 | Latehar | 968 |
Districts with Lowest Child Gender Ratio (2011)
| Rank | District | Child Gender Ratio |
|---|---|---|
| 1 | Dhanbad | 916 |
| 2 | Bokaro/East Singhbhum | 923 |
| 3 | Ramgarh | 927 |
| 4 | Hazaribagh | 933 |
| 5 | Ranchi | 938 |
Literacy and Social Demographics
Literacy rates are a key indicator of human development, while the distribution of religious and caste groups highlights the social fabric of the state.
Literacy Rate Overview (2011)
Jharkhand’s overall literacy rate was 66.41% in 2011, a significant improvement from 53.56% in 2001. Despite this progress, the state ranked 32nd nationally, indicating room for further development.
| Classification | Literacy Rate (2011) | Literacy Rate (2001) |
|---|---|---|
| Male Literacy Rate | 76.84% | 67.3% |
| Female Literacy Rate | 55.42% | 38.9% |
| Rural Literacy Rate | 61.1% | 45.7% |
| Urban Literacy Rate | 82.3% | 67.5% |
Districts with Highest Literacy Rate (2011)
| Rank | District | Literacy Rate (%) |
|---|---|---|
| 1 | Ranchi | 76.06 |
| 2 | East Singhbhum | 75.49 |
| 3 | Dhanbad | 74.52 |
| 4 | Ramgarh | 73.17 |
| 5 | Bokaro | 72.01 |
Districts with Lowest Literacy Rate (2011)
| Rank | District | Literacy Rate (%) |
|---|---|---|
| 1 | Pakur | 48.82 |
| 2 | Sahebganj | 52.04 |
| 3 | Godda | 53.09 |
| 4 | West Singhbhum | 58.63 |
| 5 | Latehar | 59.51 |
Literacy by Demographic Group (2011)
| Category | District | Literacy Rate (%) |
|---|---|---|
| Highest Male Literacy | Ranchi | 84.26 |
| Lowest Male Literacy | Pakur | 57.06 |
| Highest Female Literacy | Ranchi | 67.44% |
| Lowest Female Literacy | Pakur | 40.52% |
| Highest Literacy among SC | Lohardaga | – |
| Lowest Literacy among SC | Palamu | – |
| Highest Literacy among ST | Lohardaga | – |
| Lowest Literacy among ST | Koderma | – |
Population Distribution by Religion (2011)
Jharkhand exhibits a diverse religious landscape, with a significant proportion of the population adhering to various faiths.
| Religion | Percentage (%) |
|---|---|
| Hindu | 67.83% |
| Muslim | 14.53% |
| Christian | 4.30% |
| Sikh | 0.22% |
| Buddhist | 0.05% |
| Jain | 0.03% |
| Others | 13.04% |
Scheduled Caste (SC) Population Distribution (2011)
The total Scheduled Caste (SC) population in Jharkhand was 3,985,644, constituting 12.08% of the state’s total population.
Districts with Highest SC Population (2011)
| Rank | District | SC Population | % of SC Population |
|---|---|---|---|
| 1 | Palamu | 536,382 | 13.46% |
| 2 | Dhanbad | 437,309 | 10.97% |
| 3 | Chatra | 340,553 | 8.16% |
| 4 | Giridih | 325,493 | 8.03% |
| 5 | Godda | 319,946 | 8.03% |
Districts with Lowest SC Population (2011)
| Rank | District | SC Population |
|---|---|---|
| 1 | Latehar | 15,330 |
JPSC Relevance
The population statistics of Jharkhand are highly relevant for the UPSC Civil Services Exam and JPSC, particularly for the Jharkhand PCS. This data is crucial for:
- GS Paper 1 (Geography & Society): Understanding population distribution, density, growth, gender ratios, and tribal demographics.
- GS Paper 2 (Governance & Social Justice): Analyzing the impact of demographic trends on government policies, social welfare schemes, and addressing disparities in literacy, health, and economic participation.
- Essay Paper: Providing factual basis for essays on socio-economic challenges, development, and demographic dividends.
- Prelims & Mains: Direct questions on state-specific demographics, literacy rates, gender ratios, and the proportion of SC/ST populations are common.
Prelims Practice Questions
Which of the following statements regarding Jharkhand’s population statistics (2011 Census) is/are correct?
- Jharkhand’s overall literacy rate was 66.41%, ranking 32nd nationally.
- West Singhbhum district recorded the highest gender ratio in Jharkhand.
- The Scheduled Tribes (ST) population constituted less than 20% of the total state population.
Which of the above is/are correct?
Answer: (b)
Consider the following districts of Jharkhand:
- Dhanbad
- Ranchi
- Pakur
- Koderma
Which of the above districts recorded the lowest literacy rate and the highest decadal population growth rate respectively, according to the 2011 Census?
Answer: (b)
Frequently Asked Questions
What was Jharkhand’s total population according to the 2011 Census?
According to the 2011 Census, the total population of Jharkhand was 32,988,134. This made it the 14th most populous state in India.
What is the literacy rate of Jharkhand as per the 2011 Census?
The overall literacy rate of Jharkhand in 2011 was 66.41%. The male literacy rate was 76.84%, and the female literacy rate was 55.42%.
Which district in Jharkhand had the highest gender ratio in 2011?
West Singhbhum district recorded the highest gender ratio in Jharkhand with 1005 females per 1000 males, indicating a favorable balance.
What percentage of Jharkhand’s population belongs to Scheduled Tribes (ST)?
As per the 2011 Census, the Scheduled Tribes (ST) population accounted for 26.20% of Jharkhand’s total population, highlighting its significant tribal demographic.
Which district had the lowest literacy rate in Jharkhand in 2011?
Pakur district recorded the lowest literacy rate in Jharkhand at 48.82% in 2011, indicating a significant educational challenge in the region.