Brief Context
Context Despite India’s rise as the world’s fourth-largest economy with a nominal GDP of $3.9 trillion, concerns persist over the lack of inclusivity in economic growth. The Illusion of Growth GDP vs. Per Capita Reality: Although India’s GDP has expanded significantly, the average per capita income stands at just $2,800 (₹2.33 lakh/year), far below countries like Vietnam ($4,300) and China ($12,500).
Source Content
Syllabus: GS3/ Economy
Context
- Despite India’s rise as the world’s fourth-largest economy with a nominal GDP of $3.9 trillion, concerns persist over the lack of inclusivity in economic growth.
The Illusion of Growth
- GDP vs. Per Capita Reality: Although India’s GDP has expanded significantly, the average per capita income stands at just $2,800 (₹2.33 lakh/year), far below countries like Vietnam ($4,300) and China ($12,500).
- Extreme Wealth Concentration: The top 1% of Indians own over 40% of the nation’s wealth. The top 5% control 62%.
- If their wealth is excluded, the effective per capita income for the rest falls to ₹5,600 per month, barely above subsistence level.
- Global Comparisons: India ranks 111th out of 125 on the Global Hunger Index, and 134th on the Human Development Index — lower than peers like Vietnam or Sri Lanka.
- 80 crore people in India rely on free ration schemes under the NFSA. 230 million Indians live in multidimensional poverty.
- 35% of Indian children are stunted, indicating chronic undernutrition.
- Exchange Rate Distortion: India’s GDP in dollar terms is nominal, and heavily influenced by exchange rates.
- A weakening rupee can shrink India’s dollar-based economy without any real decline in domestic production.
- Employment Crisis: Female Labour Force Participation Rate (LFPR) is among the lowest in the world. Youth unemployment, especially among graduates, remains alarmingly high.
Reasons for wealth concentration
- Historical Factors: India’s history, including colonization and feudalism, has led to the accumulation of wealth in the hands of certain groups.
- These historical inequalities have persisted over time, influencing wealth distribution patterns.
- Economic policies, including liberalization and privatization measures implemented since the 1990s, have spurred economic growth in certain sectors, benefitting those with access to capital and resources.
- Urban-Rural Divide: Urban centers tend to attract more investment and offer better job opportunities, leading to the concentration of wealth in these regions.
- Access to Education and Opportunities: Disparities in access to education persist, particularly among marginalized communities, exacerbating wealth inequality.
Way Ahead
- Shift to Human-Centric Metrics: Focus on Human Development Indicators (HDI), Nutrition, Education, and Gender Equality alongside GDP.
- Focus on Labour-Intensive Sectors: Promote MSMEs, rural industries, and social infrastructure to create broad-based employment.
- Decentralized Planning: Empower local bodies, cooperatives, and community-based governance.
- Ecological Justice: Align growth with sustainability, climate action, and environmental protection.
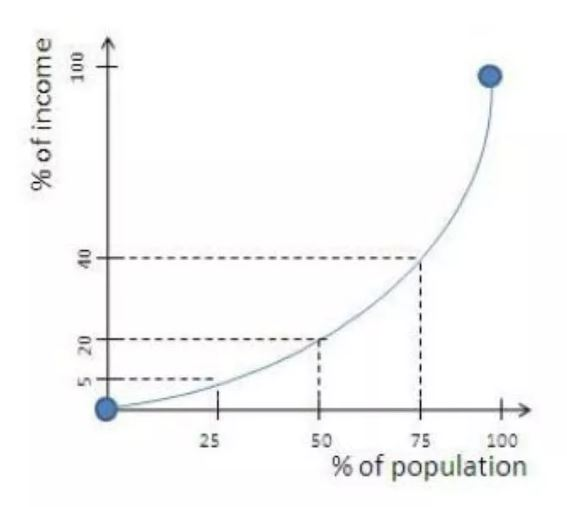
| Gini Index – The Gini index is a measure of the distribution of income across a population. – A higher Gini index indicates greater inequality, with high-income individuals receiving much larger percentages of the population’s total income. – Global inequality, as measured by the Gini index, has steadily increased over the past few centuries and spiked during the COVID-19 pandemic. |
Source: IE
| Read this in Hindi: भारत का विकास विरोधाभास |