
Introduction
Air pollution in India has become one of the gravest environmental challenges confronting India. The deteriorating air quality in both urban and rural areas is contributing significantly to respiratory diseases, environmental degradation, and reduced quality of life. Rapid industrialization, vehicular emissions, construction activities, and agricultural practices like stubble burning have worsened the situation.

Status of Air Pollution in India
Global Rankings and Reports
- According to the IQAir Air Quality Report (Swiss-based organization):
- 22 out of the 30 most polluted cities in the world are in India.
- 14 out of the top 15 most polluted cities globally are Indian cities.
- Ghaziabad, in the National Capital Region (NCR), was ranked as the second most polluted city in the world.
State of Global Air Report 2020
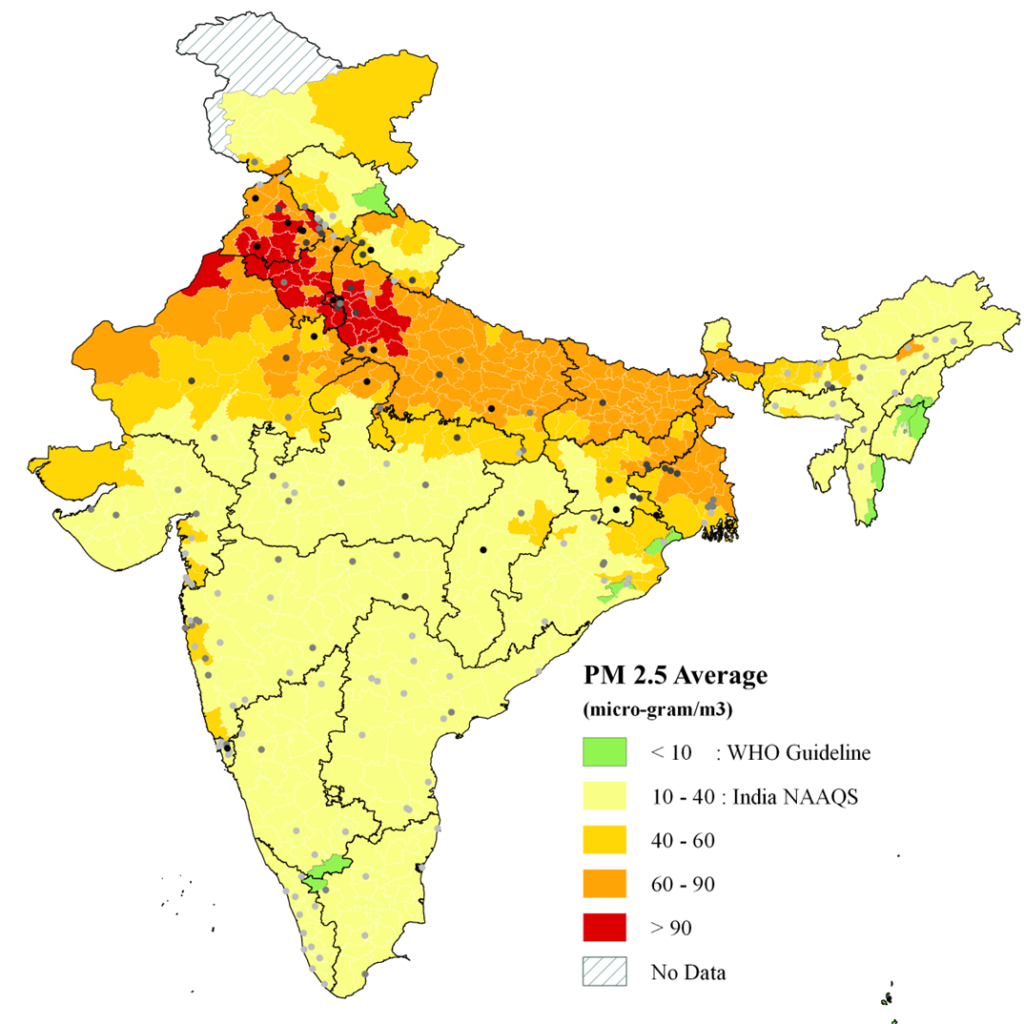
- India recorded the highest annual average exposure to PM2.5 concentration in 2019.
- For the last decade, India has had the worst PM2.5 levels globally.
World Air Quality Report 2021
- In 2021, India had 11 out of the 15 most polluted cities in Central and South Asia.
Major Pollutants in India
| Pollutant | Sources | Health Effects |
|---|---|---|
| PM2.5 and PM10 | Vehicular emissions, construction dust, industrial emissions, biomass burning | Lung diseases, heart problems, asthma |
| SO₂ and NOₓ | Power plants, diesel engines, industrial combustion | Respiratory irritation, acid rain formation |
| CO (Carbon Monoxide) | Incomplete combustion of fossil fuels | Reduces oxygen delivery in the body, especially dangerous in enclosed spaces |
| O₃ (Ground-level Ozone) | Secondary pollutant formed from NOₓ and VOCs in sunlight | Eye irritation, decreased lung function |
| Volatile Organic Compounds (VOCs) | Solvents, paints, vehicle exhaust | Some are carcinogenic and contribute to smog |
| Lead and Heavy Metals | Battery recycling, industrial discharge | Neurological disorders, especially in children |
Government Interventions to Combat Air Pollution in India
1. National Air Quality Monitoring Programme (NAMP)
Introduction
The National Air Quality Monitoring Programme (NAMP) is India’s flagship scheme for ambient air quality monitoring. It is executed by the Central Pollution Control Board (CPCB) in collaboration with State Pollution Control Boards (SPCBs), Pollution Control Committees (PCCs), and other recognized agencies across the country.
As of 19th November 2024, the NAMP network comprises:
- 966 operating stations
- Spread over 419 cities/towns
- Across 28 States and 7 Union Territories
Objectives of NAMP
NAMP is designed with a scientific and regulatory framework to guide India’s air quality management strategies. The key objectives include:
- To determine status and trends of ambient air quality across various urban and rural locations.
- To evaluate compliance with the National Ambient Air Quality Standards (NAAQS).
- To identify Non-Attainment Cities — those cities where air quality consistently violates prescribed standards.
- To provide data for policy formulation and develop preventive/corrective strategies to reduce air pollution.
- To understand the natural cleansing mechanisms in the environment such as:
- Pollution dilution
- Dispersion by wind
- Dry deposition
- Precipitation
- Chemical transformation of pollutants
Pollutants Monitored under NAMP
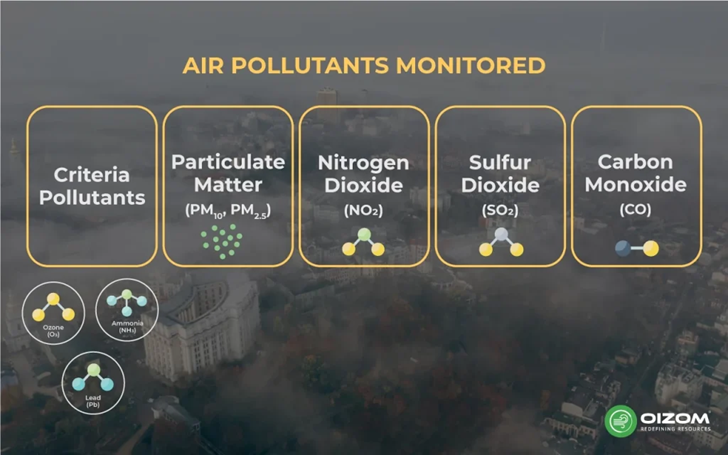
Under NAMP, four critical air pollutants are regularly monitored at all designated stations:
| Pollutant | Details |
|---|---|
| Sulphur Dioxide (SO₂) | Emitted from fossil fuel combustion; precursor to acid rain |
| Oxides of Nitrogen (NO₂) | Mainly from vehicular and thermal power emissions; causes respiratory ailments |
| Respirable Suspended Particulate Matter (RSPM/PM10) | Particles ≤ 10 μm; penetrate lungs and cause bronchial issues |
| Fine Particulate Matter (PM2.5) | Particles ≤ 2.5 μm; deeply penetrate lung alveoli and enter bloodstream |
These pollutants were selected based on their prevalence, health impacts, and regulatory importance under the Air (Prevention and Control of Pollution) Act, 1981.
Meteorological Parameters Also Measured
To better understand pollutant behavior and dispersion, meteorological parameters are monitored alongside pollutant levels:
- Wind Speed and Wind Direction
- Temperature
- Relative Humidity (RH)
These factors influence the spread and transformation of pollutants and are crucial for air quality modelling.
Monitoring Frequency and Methodology
| Parameter | Sampling Duration | Frequency |
|---|---|---|
| Gaseous Pollutants (SO₂, NO₂) | Every 4 hours | Twice a week |
| PM10 | Every 8 hours | Twice a week |
| PM2.5 | 24-hour composite sampling | Twice a week |
This gives a total of 104 observations per year per station, providing a statistically significant dataset for long-term analysis.
Operational Framework
- NAMP is operated by:
- CPCB (Central Pollution Control Board)
- SPCBs (State Pollution Control Boards)
- PCCs (Pollution Control Committees)
- Other Authorized Monitoring Agencies
- CPCB’s Role:
- Coordinates with state and regional agencies
- Ensures data standardization and quality control
- Provides technical and financial assistance
- Facilitates uniform sampling and reporting methods
Limitations and Data Usage
Due to the involvement of multiple personnel and agencies, NAMP data may have:
- Variability due to equipment performance or human error
- Biases introduced during sampling or analysis
- Gaps in data continuity in certain remote or under-equipped areas
Thus, the data is considered indicative, not absolute, and is primarily used for policy guidance and trend analysis rather than real-time air quality alerts.
2. National Air Quality Index (AQI) – India
Introduction
The Air Quality Index (AQI) is a standardized tool developed to effectively communicate the current air quality status in a simplified, easy-to-understand format. It converts complex, real-time pollution data into a single numerical value, color code, and descriptive category. The AQI helps the general public, policymakers, and local administrations understand the quality of air and take preventive or corrective actions.
The AQI is implemented by the Central Pollution Control Board (CPCB) under the Ministry of Environment, Forest and Climate Change (MoEFCC).
Purpose of AQI
- Public Awareness: Makes pollution data accessible to non-technical users.
- Health Advisory: Connects pollutant concentration to public health impact.
- Policy Monitoring: Enables daily tracking of city-level air pollution.
- Pollution Alerts: Helps in issuing warnings and emergency actions (e.g., GRAP in Delhi).
Components of AQI
The AQI is calculated using eight pollutants, based on their ambient concentration and associated short-term health impacts:
| Pollutant | Full Name | Type | Monitoring Time |
|---|---|---|---|
| PM10 | Particulate Matter ≤10 µm | Particulate | 24-hourly average |
| PM2.5 | Particulate Matter ≤2.5 µm | Particulate | 24-hourly average |
| NO₂ | Nitrogen Dioxide | Gaseous | 24-hourly average |
| SO₂ | Sulphur Dioxide | Gaseous | 24-hourly average |
| CO | Carbon Monoxide | Gaseous | 8-hourly average |
| O₃ | Ozone | Gaseous | 8-hourly average |
| NH₃ | Ammonia | Gaseous | 24-hourly average |
| Pb | Lead | Heavy Metal | 24-hourly average |
Each pollutant is assigned a sub-index value based on its concentration. The highest sub-index among all pollutants becomes the overall AQI value.
How AQI is Calculated
- Each pollutant’s ambient concentration is measured.
- A sub-index for each pollutant is calculated using a linear function between the concentration and health breakpoints.
Example (for PM2.5):
- 31 µg/m³ → Sub-index = 51
- 60 µg/m³ → Sub-index = 100
- 45 µg/m³ → Sub-index = 75
- The worst (highest) sub-index among the eight pollutants determines the final AQI category for the location.
AQI Categories and Health Breakpoints
| AQI Category | AQI Value | PM10 | PM2.5 | NO₂ | O₃ | CO (mg/m³) | SO₂ | NH₃ | Pb |
|---|---|---|---|---|---|---|---|---|---|
| Good | 0 – 50 | 0 – 50 | 0 – 30 | 0 – 40 | 0 – 50 | 0 – 1.0 | 0 – 40 | 0 – 200 | 0 – 0.5 |
| Satisfactory | 51 – 100 | 51–100 | 31–60 | 41–80 | 51–100 | 1.1–2.0 | 41–80 | 201–400 | 0.5–1.0 |
| Moderately Polluted | 101 – 200 | 101–250 | 61–90 | 81–180 | 101–168 | 2.1–10 | 81–380 | 401–800 | 1.1–2.0 |
| Poor | 201 – 300 | 251–350 | 91–120 | 181–280 | 169–208 | 10–17 | 381–800 | 801–1200 | 2.1–3.0 |
| Very Poor | 301 – 400 | 351–430 | 121–250 | 281–400 | 209–748 | 17–34 | 801–1600 | 1200–1800 | 3.1–3.5 |
| Severe | 401 – 500 | 430+ | 250+ | 400+ | 748+ | 34+ | 1600+ | 1800+ | 3.5+ |
Note:
- PM10, PM2.5, NO₂, SO₂, NH₃, and Pb: 24-hourly average values.
- CO and O₃: 8-hourly average values.
Color Codes for AQI Categories
| Category | Color | Health Advisory |
|---|---|---|
| Good | Dark Green | Minimal or no impact |
| Satisfactory | Light Green | Minor breathing discomfort to sensitive people |
| Moderately Polluted | Yellow | Discomfort to people with heart/lung disease, children, elderly |
| Poor | Orange | Breathing discomfort on prolonged exposure |
| Very Poor | Red | Respiratory illness on prolonged exposure |
| Severe | Dark Maroon | Serious respiratory effects even on healthy people; emergency action may be needed |
Significance of AQI in Policy and Public Health
- Real-Time Data: AQI is displayed publicly on platforms like SAFAR, AQICN, CPCB, etc.
- Basis for Action Plans: Used for implementing Graded Response Action Plan (GRAP)